Having set up several cart abandonment winning strategies for our ecommerce clients we know that HubSpot is a great vehicle for reducing cart abandonment. It not only allows you to harness your marketing and sales teams expertise to win back carts, but it can also be used as a powerful way to report on cart abandonment and take insights for improving your process.
Understanding HubSpot’s Cart and Order Stages
The first step in both setting up and measuring a good cart abandonment process in HubSpot is understanding HubSpot’s deal (order) stages.
If you are using HubSpot’s standard ecommerce set-up these are the key stages that orders (or Deals as HubSpot calls them) go through:
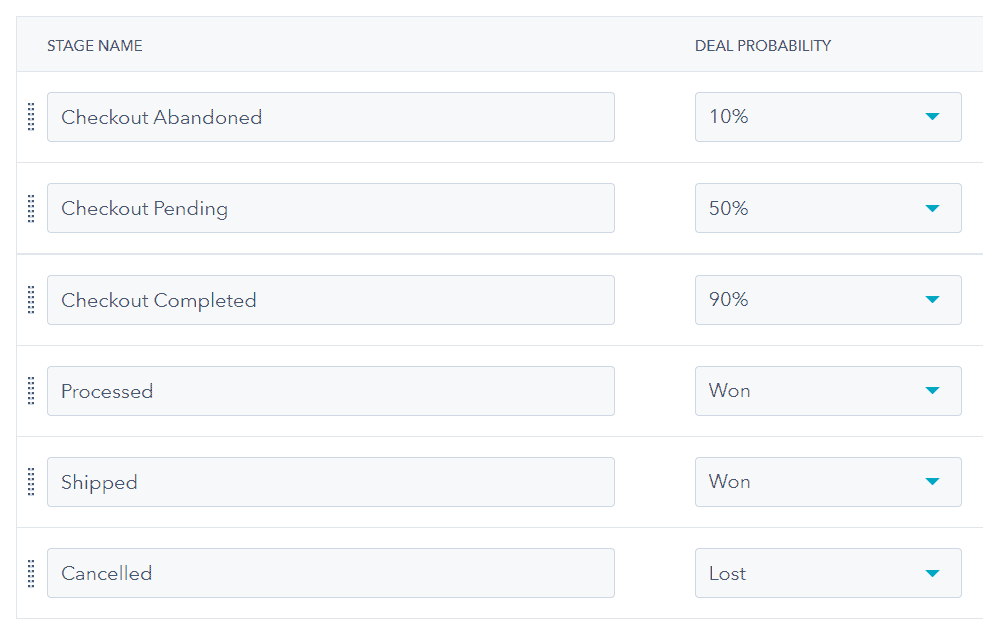
If you have set-up your deal stages in the standard way, all customer carts or baskets where payment has not yet been made will come into HubSpot at the Pending deal stage.
If you are setting up a cart abandonment process you would likely use a HubSpot workflow (automation) to move these carts (deals) to an Abandoned stage if the order is not processed after the average time it takes someone to pay and checkout for your business.
Any orders that then go on to be completed by the customer will move into the Completed stage and then Processed once the payment is fully processed and the order is accepted internally. It will then be moved to Shipped when the order has been dispatched (which is useful for customer service teams).
Thanks to HubSpot’s deal stage system we can easily measure how many carts (or deals) that are at any point moved to Abandoned (where someone does not checkout in the average checkout time) are then moved to the Completed, Processed, and Shipped stage so you can measure your recovery rate of abandoned carts.
Useful Reports to Set-Up in HubSpot for Cart Abandonment
Once your cart abandonment process is in place in HubSpot you can start measuring how many of these carts you are recovering. There are a couple of simple reports we always recommend creating to measure this.
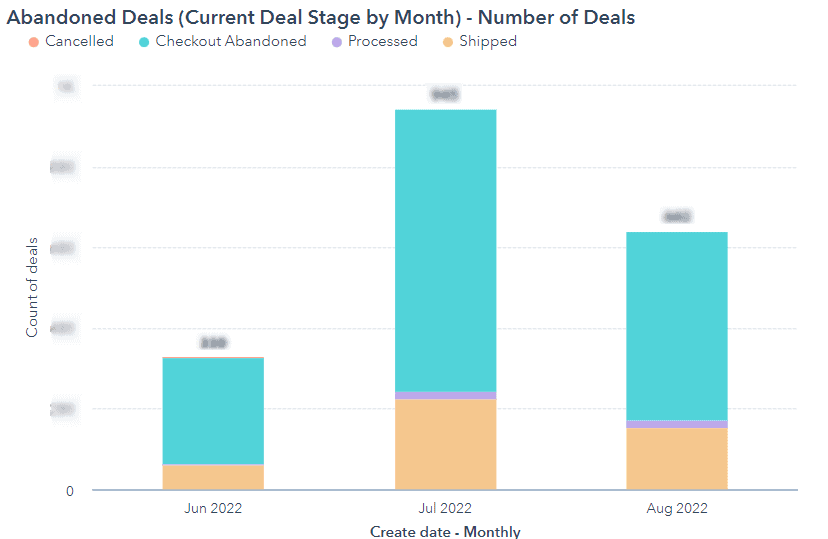
The first report we always set-up for our clients is an overview of how many carts (deals) that have been in the abandoned stage have moved to another stage.
We can also create a version of this that shows the amount of revenue from these abandoned deals that have been recovered by the process.
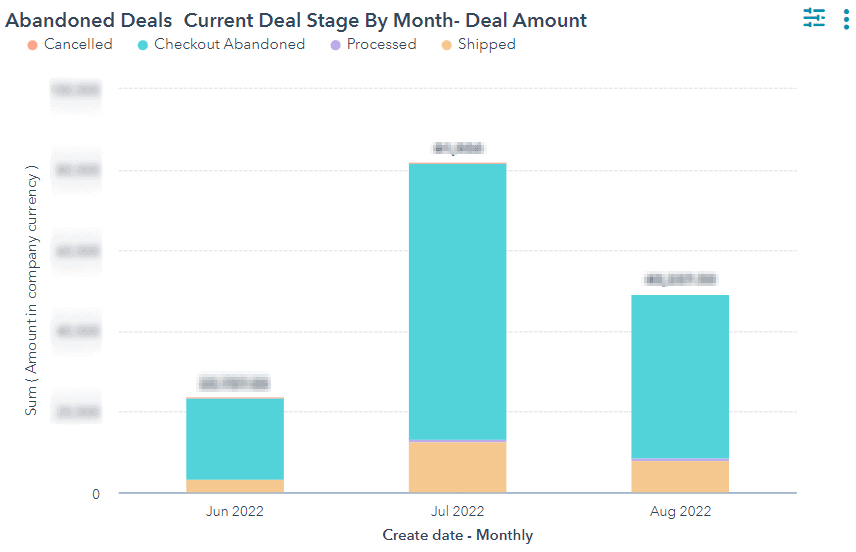
You can change the frequency of your date property to report weekly, monthly, quarterly, or yearly so you can see recovery rates over a period that is useful for your business to glean insight and monitor the success of your campaign.
These reports allow you to measure the volume of orders or the revenue amount that was abandoned that you have won back (the amount that is now checkout completed, processed or shipped).
In addition to these simple reports, you may want to drill into the methods of cart abandonment you are applying to see what is working best.
Gleaning Insight to Improve Cart Recovery
There are varying methods for your business to win back carts and ecommerce businesses are experimenting more and more with new strategies. Most ecommerce businesses will employ email as their primary method of winning back carts with many also utilising paid social abandoned cart ads. We worked with a business who also tested using calls as a method of recovering customer carts. There are also great options for targeting your abandoning users using SMS and WhatsApp HubSpot integrations that you can explore. If you are testing different cart winning strategies across different channels it is important to be able to measure the effectiveness so you can adjust your strategy accordingly. Luckily HubSpot reporting allows you to do this!
Campaign Attribution Reporting
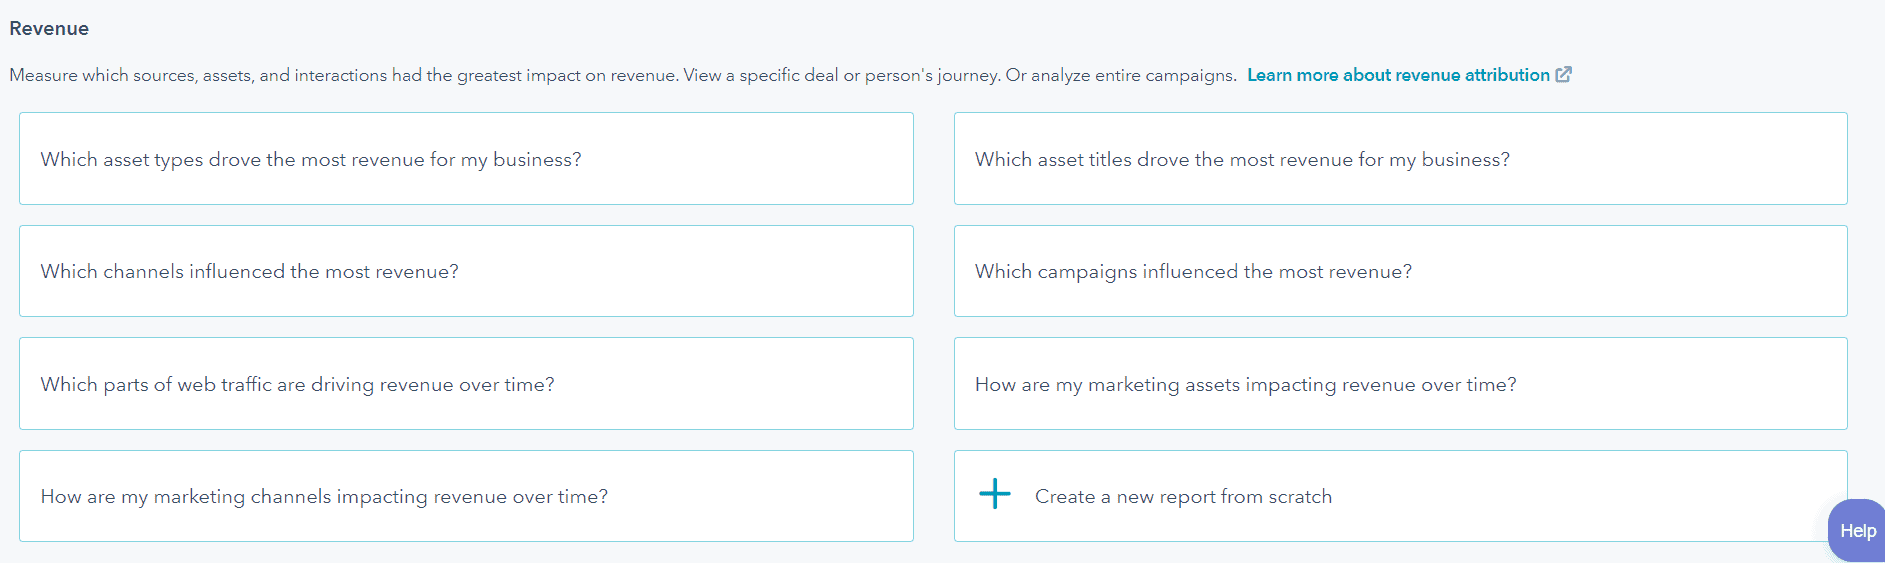
If you have added all of your cart abandonment assets into one campaign in HubSpot you can create your own attribution report based on asset title, asset type or channel in order to see how different channels or types of asset performed.
Here is a step by step for creating your own:
- In the Reports tab in HubSpot click the orange Create report button.
- Select Attribution
- Scroll down to the Revenue section. Here you can select the question that you are looking to answer (we often look at asset titles for granular detail) and click next:
- Which asset types (marketing email, ads etc.) drove the most revenue for my business?
- What asset titles (Abandoned Cart Email 1, Abandoned Cart Email 2 etc.) drove the most revenue for my business?
- What channels (email, paid search, paid social etc.) influenced the most revenue?
- Once you have selected your question you can then manipulate the chart type etc. and change or add more attribution models to your report (e.g. Linear, Last touch etc.)
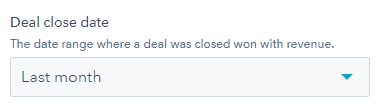
- There are also filters you can apply. The most important filter to apply is to select your Campaign and choose the nomenclature that you have used for your cart abandonment HubSpot campaign. You can also change the deal close date range within the filters to see results for different periods.

6. Once you are happy with the report, simply save it by clicking the orange button in the top right of your screen.
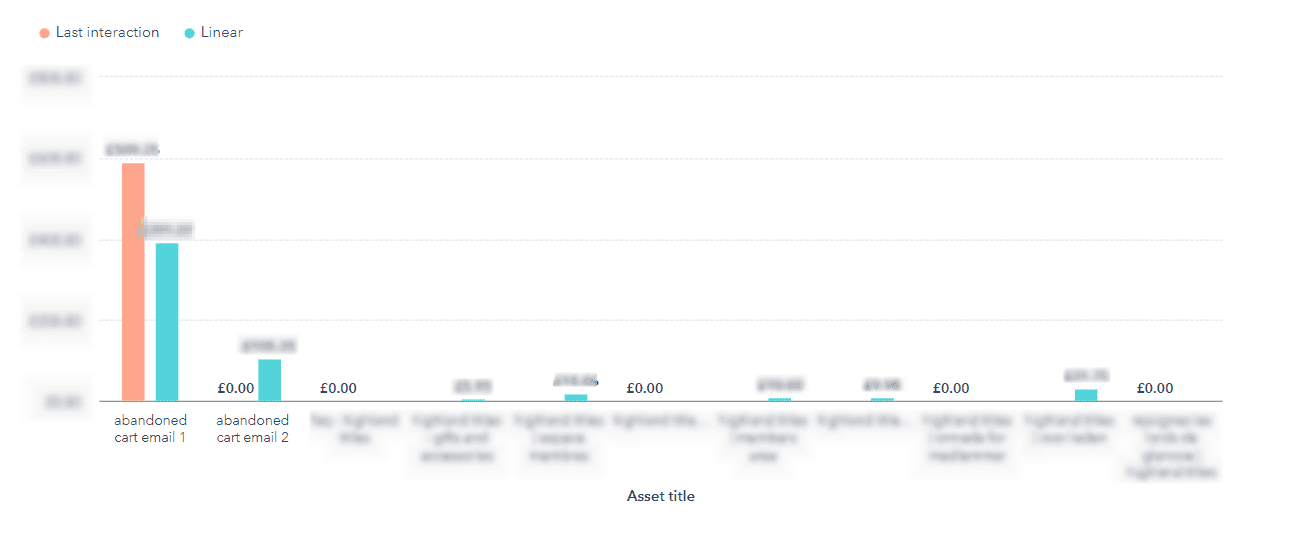
This report is really useful for seeing what assets or channels are driving the most revenue within your abandoned cart campaign so you can add in more of the types of assets/ or put more budget behind certain channels that are working into your process and make adjustments to touchpoints that are not as fruitful. For example if you see that one of your emails is not performing as well you could take a look at the open rate and CTR to see if these can be improved vs emails that are working more effectively and take learnings from emails that are working better and run some A/B testing of new CTA’s subject lines and messaging to find what works best.
Create Your Own Custom Reports
In cases where your approach is more bespoke, you may wish to create your own custom reports. That is also something we can and are happy to help you with.
For example, one of our clients makes calls to people who have abandoned their cart to help them complete their order over the phone so we created a bespoke way to measure this for them using lists and call properties. Using a new call property (a call outcome property that the customer service team populates after every call) we created a report to show the rate of recovery based on the call outcome.
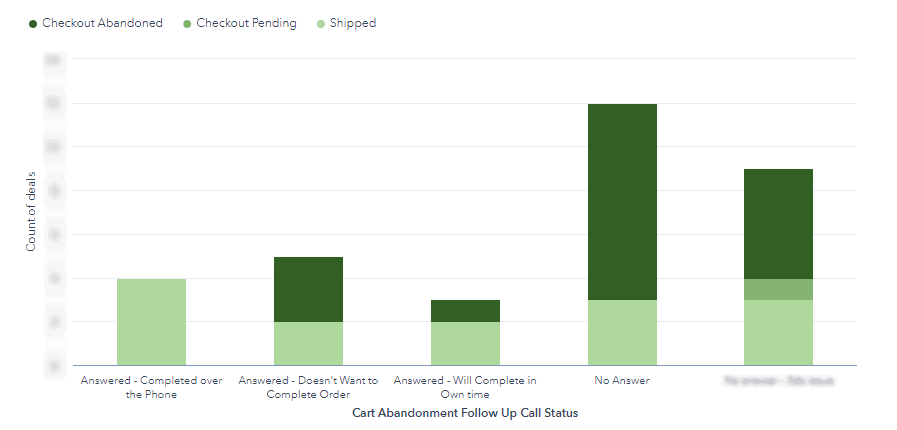
This was useful for identifying that if the team could get someone on the phone they were much more likely to complete their order. This helped the client make the case for putting a lot more manpower behind their call efforts which led to great successes in improving their rate of recovery.
There are an endless number of reports you can create using HubSpot’s reporting functionality that can help you better understand how your cart abandonment efforts are working to help you improve the process. Why not start thinking about how HubSpot can help your business improve your cart recovery and reporting efforts?
If you would like to discuss cart abandonment then please click on the link to arrange a meeting.
![]()