A quick, fool-proof approach for mere mortals to get their data out of Universal Analytics (GA3) before Google deletes it forever.
This post outlines a free and pragmatic way to save your old universal analytics (UA) data into a spreadsheet before it gets deleted on the 1st July. It uses Attacat’s souped-up template rather than Google’s lousy one. Suitable for anyone who has used Google Analytics and can use basic spreadsheets. No technical knowledge required!
Overview of the process
- Open Attacat’s free Google Sheet
- Get the Google Sheets add-on
- Find your UA view number
- Hit run!
- Check and file away your data
Background
Fact: Your old data will be deleted on 1 July 2024
Google forced the world to move to its new version (GA4) of Google Analytics last July. Unlike previous version changes, historic data was not carried over as it is incompatible with the data being collected by GA4. For example, a GA3 page view does not equal a GA4 page view as they are measured differently.
So you probably have an old “Universal Analytics” (aka GA3) property in your Google Analytics account containing years of interesting data. If you don’t save this before 1st July, it will be lost forever.
A practical approach to saving your data
Google has outlined various approaches to exporting your data from the excruciatingly painful and largely useless (downloading individual reports) to using the techies-only API. Let me cut through these suggestions for you: the Google Sheets add-on (with a little Attacat freebie thrown in) will almost certainly be the right way forward.
The Google Sheets add-on allows you to rapidly suck a lot of data straight out of GA and into a regular spreadsheet without the need for any technical expertise. By following the instructions below, you can get everything you need with as little as 10 minutes work.
Using the add-on with the Attacat template instead
Google has provided their suggested template to use with the add-on which they claim will deliver the “most commonly used reports from the GA UI”. The contents of the template determines what data is exported by the add-on. I had a go with it and rapidly concluded that the template has not been created by someone who actually uses GA!
So I’ve had a happy day or so, creating my own version which I believe will instruct the ad-on to export all the key information that most businesses will ever be likely to have a need to call on. You can get it here.
How does the Attacat template compare to the Google template?
Steps in detail
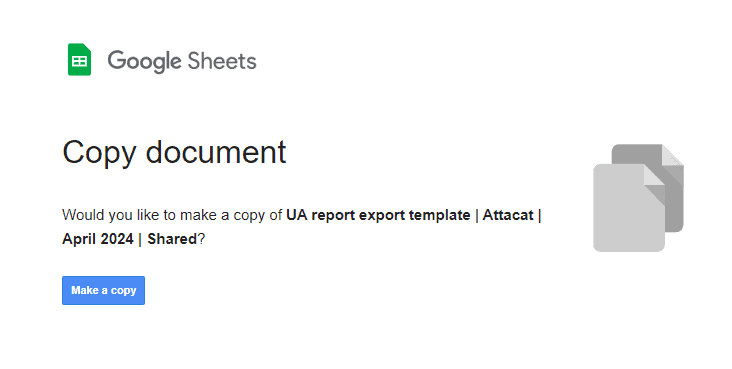
1. Make a copy of the Attacat Google Sheet Template
Simply help yourself to our template here. (Note: you must be logged into the google account that you use to access Google Analytics)
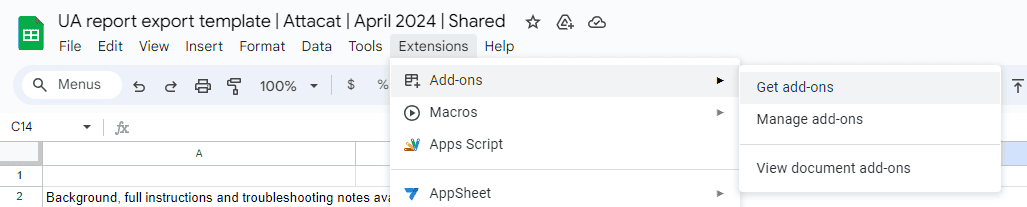
2. Install the Google Analytics add-on
In the extensions menu select Add-ons and Get add-ons:
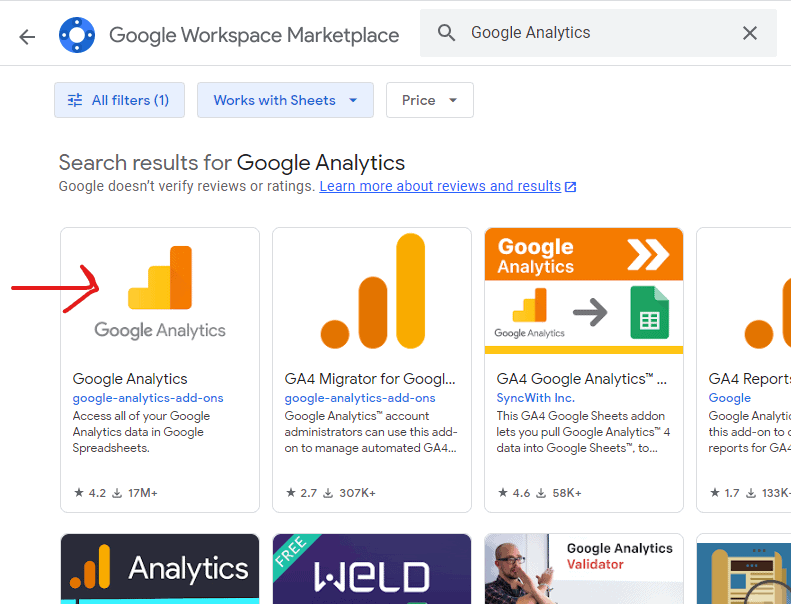
And then search for the Google Analytics add-on and select it to install it:
3a. Find your UA view number
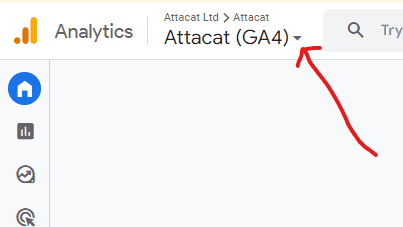
Now go into your Google Analytics account and find your old Universal Analytics reports. There are various ways of getting there but my advice would be to:
- Navigate to your old reports using the drop-down in the top left of your screen.
 You’ll need to find your way to the right “view” by first selecting your UA Property from the “Properties & Apps” column.
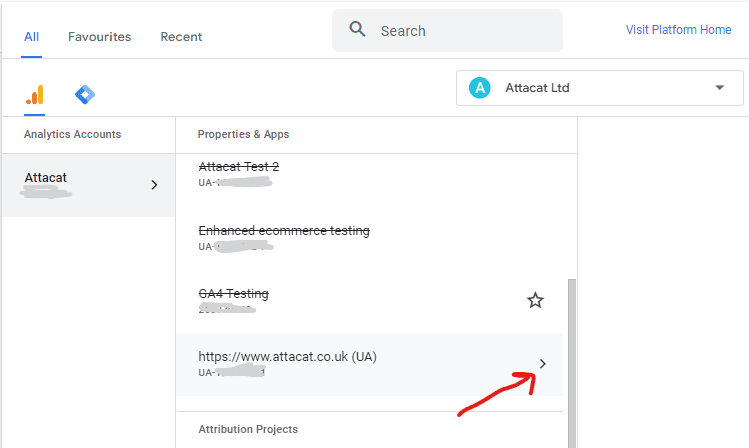 and then finding the right view:
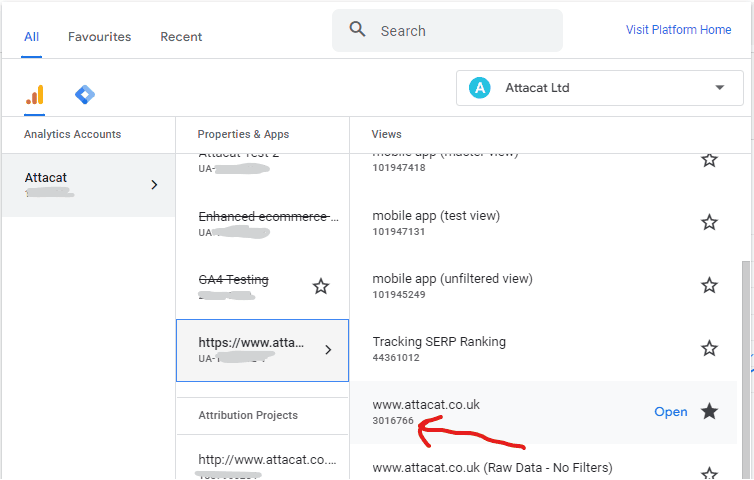
- Check you have the right “view” by looking at the reports and sense-checking the data. My suggestion would be to go to Audience > Overview.
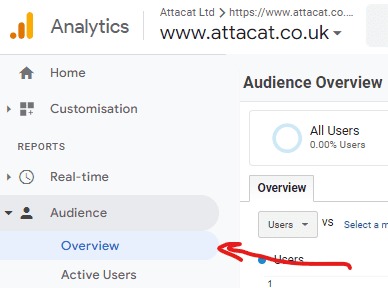
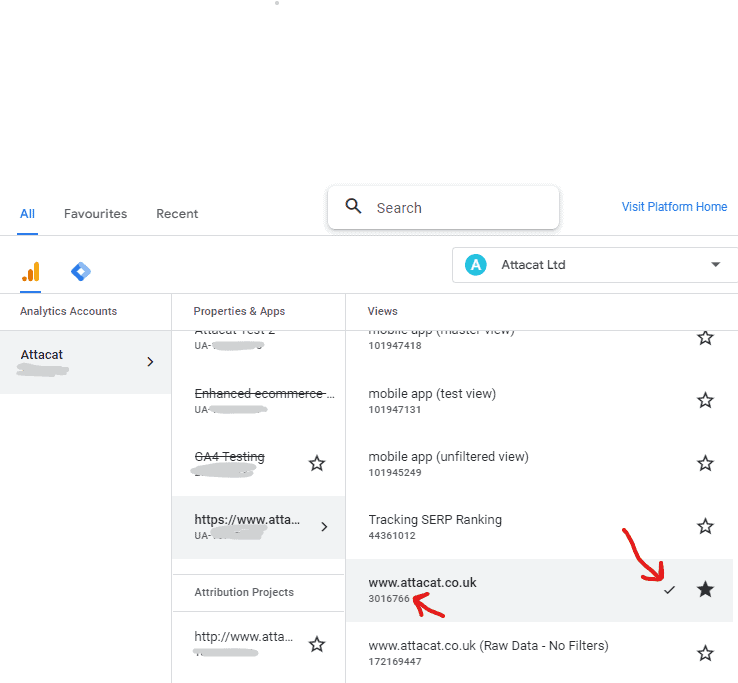
Whilst you are here change the date range so you go back to 1st Jan 2005 and work out how far back in time your data goes (note down the start date for later).The “All pages” report is also a good one to help you confirm that you have the right view. - Now find your view number by again clicking on the top left drop-down and the window you were in previously will re-open but this time with a tick against the view. It’s the number shown that you want.
3b. Enter your UA view number into your spreadsheet
Now go back to the copy you have made of the Atacat template sheet and enter your view number into the yellow cell (It’s in the “instructions” tab of the spreadsheet)
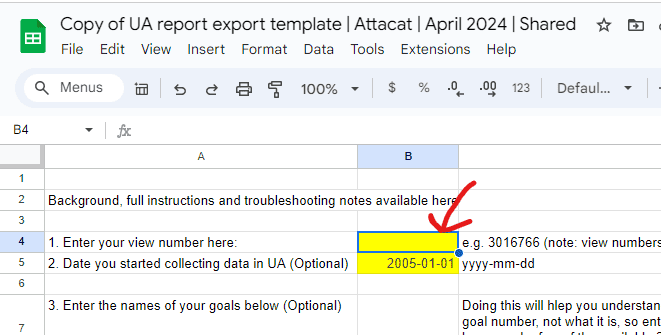
Optional but highly recommended additional steps:
- Enter the date you first set up analytics (in a UA report, set the from date to 1 Jan 2005 and then see when you first start collecting data).
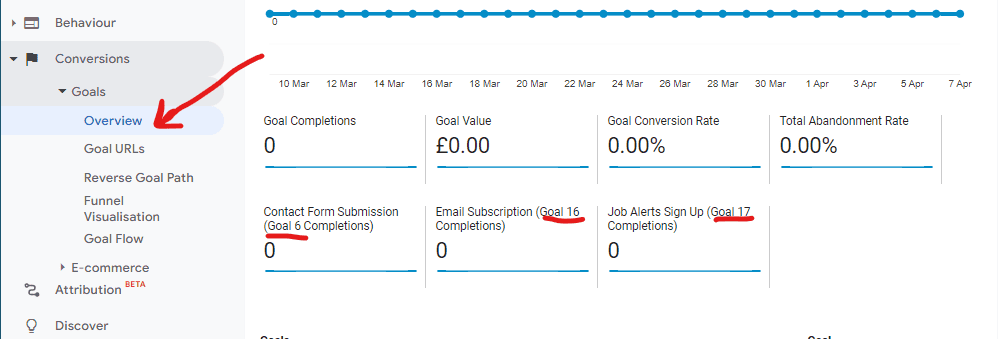
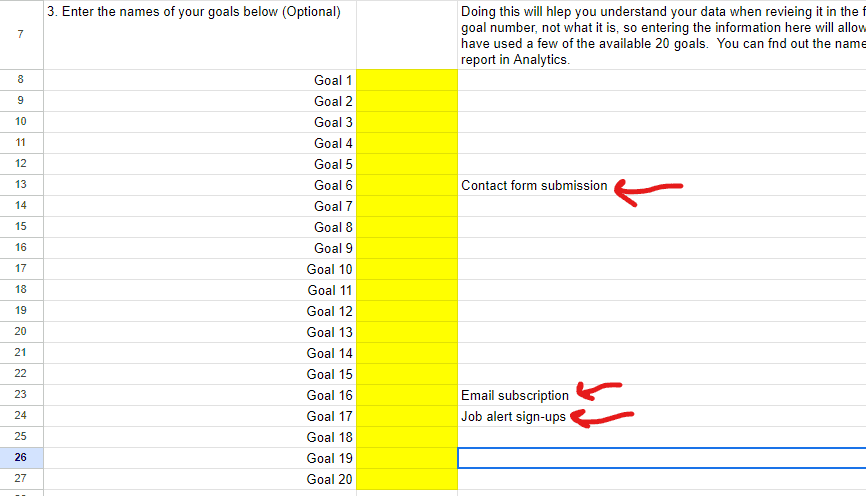
- Enter your goal information. You can find that in Analytics under Conversions > Goals. So for example:
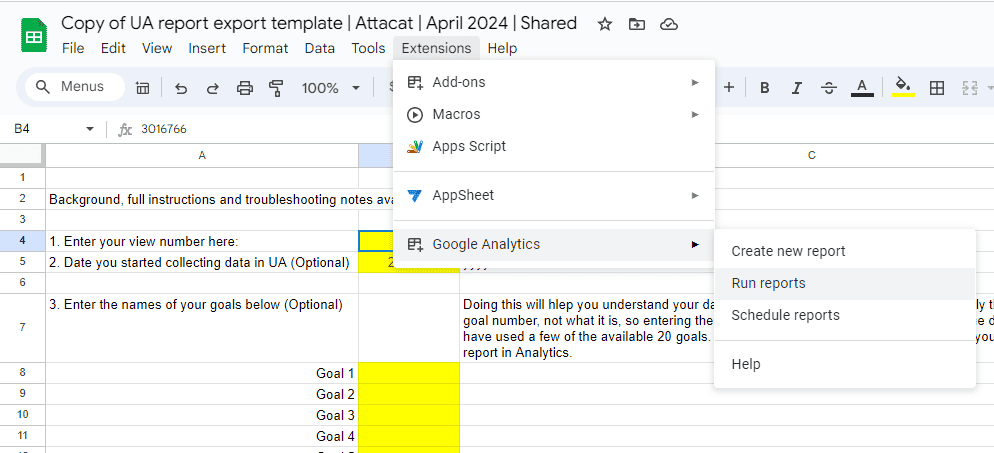
4. Run the export
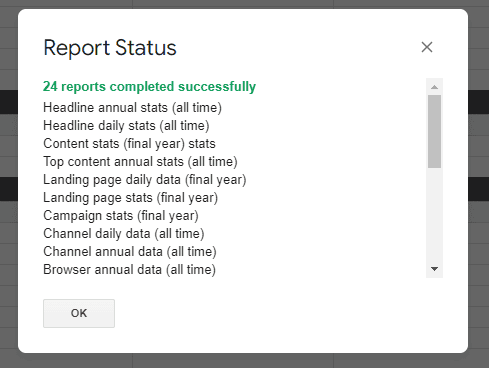
This should be the simple bit! In the spreadsheet go back to the extensions menu, select “Google Analytics” and then “Run reports”. And after 30 seconds or so your data will have been exported to 24 gorgeous tabs of reports and data dumps. Just check that your status says “24 reports completed successfully” (if it says 23 or less investigate!! Something is up!)
Troubleshooting
For most people the export should just happen without a problem but occasionally you may run into an issue, especially if you have a very big or busy site. If you do hit issues, it’s likely due to one or more of the below factors:
- The “date glitch” – occasionally we’ve seen reports only run 2022 and 2023 data even when more historical data has been requested. In most cases we “solved” this by updating the date in the instructions sheet to the date when data first started to be recorded by Analytics. It feel like the system takes a huff if it has to chuff through many years of null data. It can cause the system to choose its own dates and decide to not include some data. So update the date to the date you started collecting data and re-run. (Update 18/04/24 – seeing increasingly that putting in a date of 23/08/2016 or later seems to solve the problem. Why? Who knows!)
- It requires the connections with Google Analytics to work perfectly. Whilst good it may be occasionally temperamental. Solution: re-run the report (Tip: Use row 13 (Skip) in the “Report Configuration” tab to only run the report(s) you want to re-run by putting the word “TRUE” in row 13 for all the reports you don’t want to run.)
- Successfully run reports with no data:
- If Analytics was never configured to collect the data we are trying to export, then there will be no data to export. For example if you don’t have site search set-up, there will be no data in the site search exports. This is also common with some of the more niche ecommerce reports (coupons etc)
- Landing page data – if you get zero data here its likely due to the filter being used to try to keep these exports manageable. Try deleting the filters for these exports (cells F9 and G9 in the report configuration tab) and re-run the report. (Ecommerce site? Try tweaking the filter from “ga:goalCompletionsAll” to “ga:transactionRevenue”)
- Limits exceeded
- Row limits (10,000?) – these can be exceeded in reports with data on pages or search terms. Where this happens the best place to start is to look for the troubleshooting notes (row 23) in the “report configuration” tab for the report in question.
- Spreadsheet size limit (10,000,000 cells) – this is unlikely to be an issue but find the report causing the issue by running a few reports at a time.
- Daily query limit – I haven’t hit this yet but if it happens to you, try coming back tomorrow to complete the job
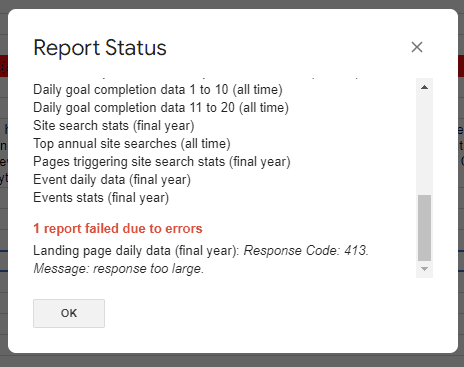
For further troubleshooting, you will probably need to follow the notes for advanced users below but the Report Status will often guide you as to what the problem is.
Example report status error reporting giving insight into what the issue likely is
Advanced users
The magic all happens in the “Reports Configuration” tab of the sheet. You can create any report you want by making changes in rows 2 to 17 or adding additional reports in further columns.
Some useful resources if you want to get your hands dirty:
- What each row in the configuration tab does (“the parameters”)
- The dimensions and metrics explorer – the place to go to when you have a particular column or row in mind that you want to include in a report.
Tip: Use row 13 (Skip) in the “Report Configuration” tab to only run the report you want by putting the word “TRUE” in row 13 for all the reports you don’t want to run.
5. Checking your data
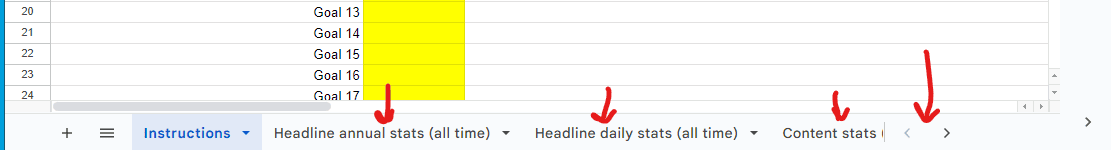
Your data has now been exported into individual sheets within the spreadsheet. You can navigate between them using the tabs at the bottom of the sheet (you’ll need to scroll left and right using the < and > to see all your tabs/exports)
You need to check your data now as you won’t be able to after 1st July. So you need to have faith that the data is accurate and you have all the data you need. Here’s what I suggest:
- Run through all your exports (i.e. each tab of the spreadsheet) and get to know them. Do you understand the data, does the data look sensible?
- Check your headline daily stats (all time) report against the data in Universal Analytics “Audience Overview” report by comparing a couple of random days.
- (Optional) Now go to your GA3 (Universal Analytics) reports in the GA interface for one last time. Wade through every report in there and decide whether there is any report that you used a lot but isn’t covered by the exports. If there is, it’s time to become an advanced user (see above).
Question: Do I need to export all my data out of Google Analytics?
Answer: No. This is neither possible nor frankly worthwhile. Individual data types are not equally valuable to you and the older the data is, the less valuable it is. Our approach is to take a good range of “All time” data at both the daily and annual levels and then take some additional data from the last full 12 months of GA3 data collection (1 July 2022 to 30 June 2023)
6. Saving your data
Where you save your data will be a matter of personal choice. If you are not a regular Google sheets user you can export your data in excel format.
[image]
7. Please tell me how you got on!
I’m keen to make this as easy to use and as useful as I can, so would love to hear how you have got on with it, any issues and any improvement ideas. Please drop me a line here.