About the P.S. from Attacat newsletter
P.S. = Problem Solved
This monthly newsletter aims to create the “I didn’t realise HubSpot could do that” moments for our clients and other invested HubSpot users. Each month, we’ll share feature updates, opinions, and inspiring real-world examples, large and small, to help you rethink what’s possible with HubSpot.
Best delivered straight to your inbox…Subscribe Today >
In this edition
- Conference Review: HubSpot sets out its vision for your human/AI hybrid team – How HubSpot sees AI agents and assistants as your new co-workers and what you need to do to begin embracing this brave new world.
- HubSpot updates
HubSpot sets out its vision for your human/AI hybrid team
This year’s conference was, of course, all about AI. We wouldn’t expect anything less, but behind the hype was HubSpot’s clearest vision yet for how customer communications, and with it, the HubSpot product, are changing with AI.
The core idea is your human-led team delivering increasingly personalised communications with the assistance of AI co-workers handling most of the grunt and scale.
HubSpot sees itself both as your data store and the provider of these AI co-workers to carry out tasks for you such as:
- Cleansing your customer data;
- Enhancing it with publicly available information and insights from your emails, chats, meeting notes, and calls;
- Responding to customers through chats and emails;
- Creating campaign assets such as landing pages and ads at a previously unimagined speed and quantity;
- Buying media;
- Surfacing performance insights.
Reality or vision?
HubSpot is already rolling out many AI co-workers for you in the form of assistants and agents so this future is to some extent already here – clients are seeing early wins.
But let’s not pretend that everything will work for everybody immediately. Indeed, one of the calls to action from the conference was to keep experimenting: try something today, if it doesn’t work, try it again in a few months as the technology will have moved on again.
So it’s both a genuinely exciting prospect and a practical means for companies to meaningfully adopt AI today.
Humans in control
I was relieved and impressed by HubSpot’s emphasis on human control, rather than the common tech industry assumption that AI always knows best. So there’s lots of emphasis on AI making suggestions or generating drafts, with you approving or tweaking.

More with less?
These tools will undoubtedly deliver what customer-focused teams do today much more efficiently. On the flip side, changing customer expectations will force customer teams to deliver more and better. So we may or may not see smaller customer-facing teams.
We can, however, safely bet on the need for skills in these teams (including creative teams) to become less siloed and change quite dramatically. People who are curious and like finding better ways of doing things will see their value rise at the expense of those who prefer to simply crank the handle of a process.
The need for data quality and brand clarity
Technology is one part of the equation; being in a position to use it effectively is the other.

HubSpot presented its latest overarching marketing metaphor of “The Loop” – a continuous iteration process. Companies input their brand voice, ideal customer profile and campaign brief, and the AI handles the bulk of the campaign production and delivery. This enables targeting of increasingly smaller micro-audiences, making the long-discussed ideal of near 1-to-1 communication at scale feel closer to reality.
However, to make a success of this (or any other automated communications) these are the less sexy essentials that every AI strategy must invest in:
- High-quality and complete customer data in one system – HubSpot announced several tools to help you enhance the quality and quantity of your customer data within its platform. Broadly, they cover:
- Making all the unstructured information captured in your emails, calls, tickets, and chat interactions usable by AIs;
- Automatically enriching customer data (by researching and monitoring customers on the web, and analysing their communications);
- Easier connectivity with your other systems holding customer data;
- Improved data cleansing tools.
- Clear brand and value proposition – Many companies struggle with this, yet it’s never been more essential for success. Just as it gets all your human employees rowing in the same direction, your AI employees also need a clearly defined brand and value proposition. It might be helpful to think of your brand’s tone of voice, ideal customer profile and value proposition as the prompt for your company’s marketing, sales and service GPT. We know ChatGPT’s outputs improve with better prompts; the same applies here.
Agents and assistants
AI agents are the topic of the moment, yet like the word “AI” itself, “AI agent” means pretty much whatever the person saying it wants it to mean! It gets even harder when trying to differentiate between AI assistants and AI agents.
However they are defined though, these are the new “employees” joining your team. HubSpot are rolling out:
- Default agents and assistants;
- A marketplace (like an app store) for agents which you can add to HubSpot;
- “Breeze Studio”, allowing you to customise existing agents or create your own without code. Think of it as the training ground for these new employees.
AI tools for a world being turned upside down by AI
While HubSpot embraces AI to empower businesses with new tools to reach customers, customer behaviour is also rapidly evolving.
HubSpot’s strength, when compared to its competitors, comes from being most interested in marketing, rather than tech for tech sake. As a result, the Inbound conference is always framed around helping businesses understand changing consumer behaviour. And likewise, their product development is always focused on consumer behaviour in a way that other CRMs fall short of.
Some key marketing trends to be aware of:
- Your prospects are no longer on your website. They are now everywhere else! (Blogs are less read, while significant time is spent scrolling social media, listening to podcasts, and reading email newsletters);
- When they do arrive on your website, they are typically far more qualified, because…
- Searching is increasingly being replaced by asking questions, whether on Reddit, at industry meet-ups or in AI answer engines (such as Google AI mode, chatGPT etc). However, SEO remains crucial for discoverability in these engines.
And the key changes you need to make:
- Embrace video and audio content, especially since AIs can now readily ‘digest’ it, unlike past search engines that primarily processed text.
- Tighten up your “bottom of funnel” website content (e.g. you vs competitor, pricing, industry-specific use cases) and reformat it into a question-and-answer format, including FAQs. This is where the tailored one-to-one conversations, powered by your new AI employees, comes in.
- Drive your industry’s, or better yet, your customers’ conversations, wherever it is they happen to be.
Getting started on your HubSpot AI journey
We discussed the importance of establishing your data and branding foundations above. Thereafter, the simple advice is to just ‘have a go!’. Choose a high-priority internal process and start experimenting. There are also many low-risk, but practical marketing use cases you can try, such as creating a landing page.
We’ve also highlighted one or two of the agents we are most excited about below in this month’s product updates.
It’s still early days for everyone, so please share your experiences with us and we’ll highlight what’s working well in future newsletters for the benefit of all clients.

HubSpot updates
Are these the problem solvers you’ve been waiting for?
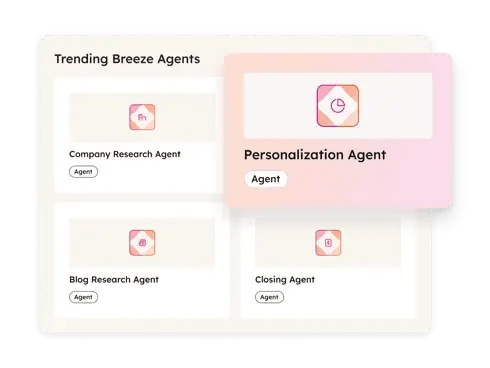
These are our picks from all the AI launches and updates from Inbound. You’ll find the agents and assistants in the new Breeze Marketplace and you can fine tune them to your own needs in Breeze Studio. There’s a one-minute or a thirty-minute overview of Breeze Marketplace and Studio if you want to learn more.
Why should we care?
Agents and assistants represent an entirely new way of working that we all must grasp. Now is the time to start experimenting if you haven’t already.
Customer Agent can now handle any type of enquiry
This agent, in our view, is one everyone should test. We are seeing increasing numbers of successful rollouts of Breeze Customer Agent for autonomously handling support tickets. Its remit is now also expanding into sales and marketing with its ability to handle any enquiry whether that’s chat, email or even voice. It can create contacts and book meetings in addition to routine tasks such as order tracking and password resets.
AI is advancing at a much faster pace than we all realise, so if it isn’t working for you yet, is it because you haven’t got your foundations (see above) in place yet?
Also worth noting: Customer Agent’s early lead in the AI co-worker league is partly due to access to quality training data. Most human-resolved tickets were in a readily digestible text format. Now that calls, audio, and video content are increasingly ‘digestible’ by AIs, we can expect agents more reliant on these sources to make significant strides.
Why should we care?
HubSpot is claiming that it’s resolving 65% of conversations automatically. That is a lot of time saved!
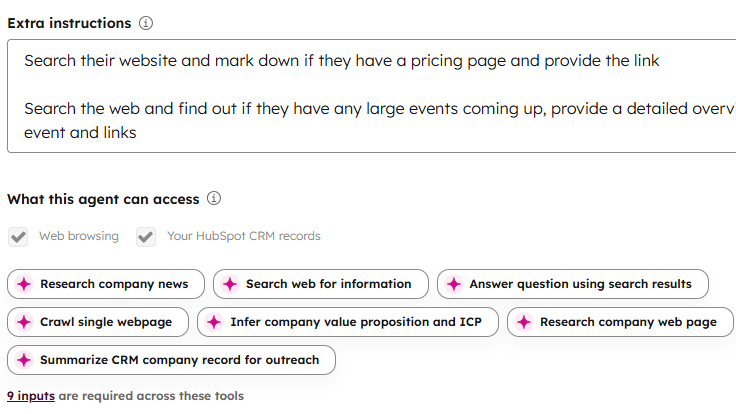
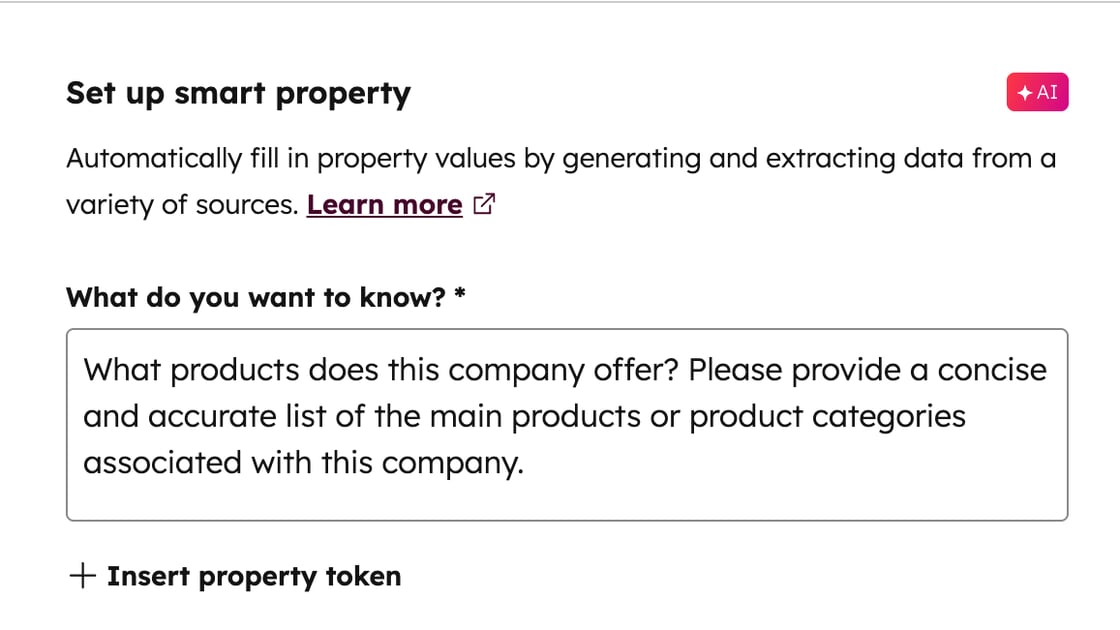
New: Company Research Agent
Gathers information about a company from its HubSpot record and/or the web. If you typically review a prospect’s website to identify their customers, this agent automates that process. The output is a dynamic card, updating with recent company news, meeting summaries, etc.
New: Data Agent
While this agent can pull similar information to the Company Research Agent, its primary output is the automatic population of properties, ideal for initial record population. It can also power automations.
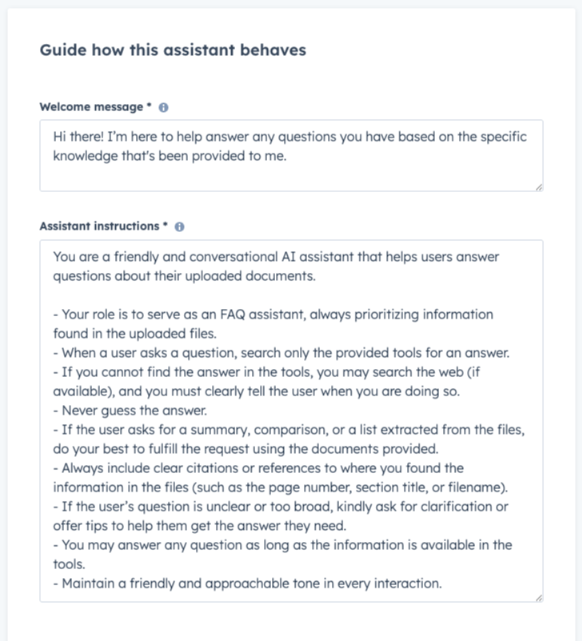
Internal FAQ Assistant
If you regularly field questions from your team despite well-developed documentation, this assistant is for you! Create an AI assistant for your team to answer questions using your trusted documentation as the source.
Two new AI features in Sales Workspace
- Use HubSpot AI to help prepare for meetings – If you’ve synced your calendar, navigate to the Workspace ‘schedule’ tab, click into a meeting, and view the Info & Insights tab. Here, among other information, you’ll find customer pain points compiled by AI from recent emails, call notes, etc. (If your meeting is today, a quicker way to do this is to just click the AI assistant from anywhere in HubSpot and the meeting will pop up there)
- The updated Deal Insights Card – it now has context from phone calls, emails, and notes etc to power the insights (find it in the Deals tab).
Why do we care?
If nothing else, the usefulness of the information or otherwise will be an indicator of how good your customer data foundation is.
Have you joined the Edinburgh HubSpot User Group?
If you find this newsletter useful, make sure you also join the Edinburgh HUG. Most events are remote so all HubSpot users are welcome to join, whether Edinburgh-based or not.
Until next time!
The Attacats
About the P.S. from Attacat newsletter
P.S. = Problem Solved
This monthly newsletter aims to create the “I didn’t realise HubSpot could do that” moments for our clients and other invested HubSpot users. Each month, we’ll share feature updates, opinions, and inspiring real-world examples, large and small, to help you rethink what’s possible with HubSpot.
Best delivered straight to your inbox…Subscribe Today >
In this edition
Next edition will be in September. In the meantime, if you have any feedback on how to make this email as useful as possible to you, please just let us know.
The art of the possible
Challenges big and small that we have been working on recently that might spark an idea for you.
Managing auction items in HubSpot
It’s not just customers you can manage in HubSpot!
Background: This auction house already had buyer and seller details in HubSpot. After all, that’s what a traditional CRM was always used for!
The problem: The client hadn’t appreciated that the auction items themselves could also be managed within HubSpot.
The solution: Using a deal pipeline to track progress of items from initial inquiry, through the valuation process, getting the item ready for sale, and all the way through to post-sale.
The “clever” bit: Using workflows to manage the internal approval processes where more than one member of staff was required to sign off on an item before it could be progressed to the next stage.
What other situations might this apply to? In addition to applying to any second-hand goods (cars, jewelry, etc.), it could be readily adapted for managing a returns process.
An approach to keeping customer data current
If you’re responsible for keeping customer data up to date, here’s an approach to consider.
Background: This company maintains information about its customers’ hobbies and sports interests, including their favourite teams.
The problem: Since these were non-standard properties in HubSpot, maintaining them was trickier than regular contact details. There’s also a limit to how often you can ask customers to update their info without inconveniencing them.
The solution: Creating reports that listed key clients whose interests hadn’t been updated recently. This allowed for a tailored approach, keeping the service personal.
The “clever” bit: Adding a “last updated date” custom property for each important data grouping. When any of the properties in that grouping were updated, a workflow would update the “last updated date” property, which could then be used for reporting.
What other situations might this apply to? Any non-standard customer profile data that tends to age.
Managing warranties
Do you offer warranties to your customers?
The problem: Warranties present operational challenges as well as revenue opportunities for customer service teams.
The solution: A system, built using HubSpot functionality, for managing warranties from surfacing expiry dates for customer service teams to automating upsell emails and processes.
The “clever” bit: A warranty custom object. The object records the level and expiry date of the warranty. It can be associated with the original sale (“a deal”) and customer records.
What other situations might this apply to? The system could be extended to ensure that any warranty requirements are met (for example, a servicing contract being in place). HubSpot has the potential to log and link all this information.
Supporting on-the-ground staff with…(better) paper!
Usually, we remove paper from operations, but sometimes we just make it better.
Background: This holiday company has in-resort teams responsible for preparing for the arrival of self-catering guests. Each guest group will have differing requirements from sleeping arrangements to kit requests. They also have the option to take advantage of a bespoke food and drink shopping service.
The problem: We had already built a system within HubSpot for gathering all this information from each guest within the group. The challenge was to make it easier for the in-resort teams to action all the requests, which could amount to 100 or more individual items.
The solution: A paper checklist! Workflows in HubSpot compile all this information into a list (and if anything is missing beforehand, reminders can be automatically sent to guests). This list is then converted to a pdf that can be easily printed out. It covers everything the in-resort team needs to tick off to ensure all is as requested by the clients.
The “clever” bit: The pdf conversion is done using a tool called Portant.
What other situations might this apply to? Part of the reason for the paper is that connectivity is poor in many of the locations where the client operates. However, the custom checklist creation process, whether on paper or in another format, could also have application for events or warehouses, for example.
(Confession: I’m a bit of a superfan of The Checklist Manifesto. It’s a great read for anyone interested in operations.)
HubSpot updates
Are these the problem solvers you’ve been waiting for?
Recommended Actions in Workflows
When you build workflows, you may notice some next steps being recommended. These AI-driven recommendations are based on similar workflows other users have created within the platform. Similarly, you can even ask the AI to build entire workflows for you using simple, plain English instructions.
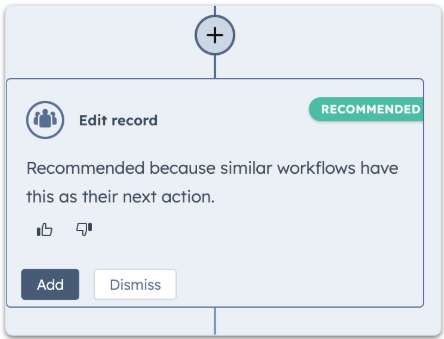
Why do we care?
These AI-driven suggestions lower the “fear” barrier of using workflows. While you shouldn’t expect them to deliver fully customised and brilliantly executed solutions, they’re a brilliant teaching aid. They can build an outline skeleton for you to modify, stimulate ideas, and offer best practice suggestions. So if you haven’t already got to grips with workflows, now is a good time to start.
Edit email conversation history in replies
When you reply or forward an email in Outlook or Gmail, I am sure you may have edited the historic email thread to:
- Remove sensitive or incorrect information;
- Help the recipient of your email to see the relevant part; or
- To reply “in line” to the questions asked in the thread.
You can now do this when sending emails from within HubSpot. Finally, you might say!
Why do we care?
The inability to do this has been a frustration. It has provided a reason not to reply from within HubSpot, which in turn led to incomplete conversation records.
Monitor your team’s training in the HubSpot Academy
There is now a “My team” dashboard in the HubSpot Academy, which will allow you to monitor your team’s engagement with the Academy courses and keep an eye on expiring certifications.
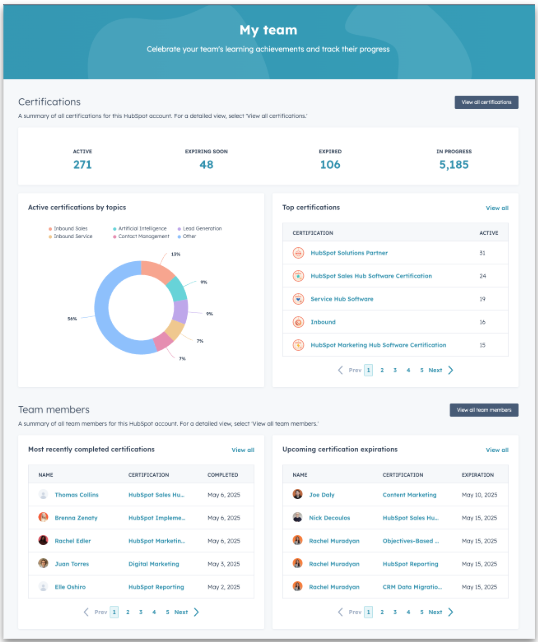
Why do we care?
The HubSpot Academy is a great, but often underutilised, self-help resource for all your employees. Having the ability to monitor certifications now gives managers the ability to “encourage” use of it in a more structured and firm way!
HubSpot AI usage is increasingly moving to a pay-as-you-go model
Breeze Intelligence credits have now been combined with Customer Agent credits and are called “HubSpot credits“. If you are on the core seats model, you get some free credits thrown in (3000 on Professional, 5000 on Enterprise). Super and billing admins can monitor credit usage within the Accounts & Billing section.

Why do we care?
It’s just something to be aware of as HubSpot and LLM pricing models continue to evolve. What you get for a “credit” remains a little opaque and will, no doubt, change over time. For now, at least, we anticipate that the productivity gains will far outweigh the costs.
A Google Ads update that will make more of your HubSpot data
Google Ads has lowered its minimum requirements for customer match lists from 1000 contacts to 100.
Why do we care?
When you are able to tell Google who your key customers are, you can then use that information to target your Google Ads in various ways. My favourite “way” is to let Google use the information to target ads at people similar to your existing customers; “Find more people like these please!”
Prior to the change, finding 1000 similar and active enough contacts to pass to Google was a big stretch for many. In our experience, most companies would end up being forced to send lists that covered the whole diversity of their customer base as well as long inactive customers. The people on the lists would have little in common that Google could use to narrow down the targeting. The 100 limit will now make it much easier to draw up a list of, say, “finance directors that have engaged in the last 90 days”. Google’s algorithm will then be able to spot the commonalities between them and find others like them. So in short, there is now a much better chance of being able to reach your key customer segments on Google.
Troubleshooting corner
Niggles put to bed. (A gentle bit of self-promotion to highlight the sort of small but painful challenges that we often end up sorting for clients). Please feel free to share your own discoveries that might help others.
- Company deliveries and/or invoices going to the wrong addresses due to a limitation in HubSpot data structure and connected financial system → Implemented a new custom object for billing accounts to allow both the delivery and billing addresses to be managed effectively.
- Companies (rather than individuals) asking not to be contacted → Created a new company level “do not contact” property which could then be copied across to all current and future associated contacts (employees) automatically.
- Unable to see a breakdown of customer spend categories → Used rollup properties for each type of spend as well as total spend. This could then be used in reports as well as contact record views
Good question!
Our view on questions we’ve been asked or have asked recently.
Q. Can we integrate our phone system (RingCentral) with HubSpot?
A.Yes, most cloud-based business phone systems can be integrated with HubSpot one way or another. RingCentral has one of the better integration apps in the HubSpot app store. Not every phone system (e.g. 3CX) will have as good an app, or an app at all. In those situations, more expensive custom integration would be required instead.
Aircall is the telephony platform we have adopted as the Attacat “standard”. It has a great integration and is a brilliant product. If you are already established on RingCentral though, then it will still do the job well.
Have you joined the Edinburgh HubSpot User Group?
If you find this newsletter useful, make sure you also join the Edinburgh HUG. Most events are remote so all HubSpot users are welcome to join, whether Edinburgh-based or not.
Until next time!
The Attacats
About the P.S. from Attacat newsletter
P.S. = Problem Solved
This monthly newsletter aims to create the “I didn’t realise HubSpot could do that” moments for our clients and other invested HubSpot users. Each month, we’ll share feature updates, opinions, and inspiring real-world examples, large and small, to help you rethink what’s possible with HubSpot.
Best delivered straight to your inbox…Subscribe Today >
In this edition
- The art of the possible
- HubSpot updates
- Troubleshooting corner
- Form submissions from site going to spam folders
- Bot-created live chat tickets swamping customer services
- Good question!
The art of the possible
Challenges big and small that we have been working on recently that might spark an idea for you.
Building a brand ambassador system
Do you have brand ambassadors or third parties promoting you but aren’t sure how they’re performing?
Background: Reaching university students is key priority for our client. One initiative is appointing student ambassadors on each campus to promote the brand.
The problem: No way to measure how effective the ambassador program is, even in aggregate.
The solution: Creating a landing page with a HubSpot form and assigning each ambassador a unique URL. Interested students would use this link to register, and their submission would be credited to the ambassador. This enables HubSpot to report the impact at overall, campus, and individual levels.
The “clever” bit: Hidden fields in the HubSpot form capture the association between the lead and the ambassador.

What other situations might this apply to? This “unique form” approach works for sales agents, referral partners, or campaigns like exhibitions or videos—anywhere you control the exact sign-up URL. (Tip: use a QR code.)
When you have to offer a sub-optimal customer experience
There are countless reasons why you may not be able to offer the level of service your customers expect. Could clearer communication help?
Background: Our client fulfils orders on behalf of a government department.
The problem: Orders took far longer than expected because they had to be individually approved by another government department. The process was slow, inconsistent and completely outside the control of our client. Yet it was the client’s reputation that suffered.
The solution: Using HubSpot’s Customer Portal feature to show order progress.
The “clever” bit: Clearly highlighting where delays occurred, who was responsible(!) and setting expectations from the start.
What other situations might this apply to? Any scenario involving manual or delayed approvals e.g supplier payments, onboarding, recruitment, credit checks, insurance claims.
Reporting on Gross Margin in HubSpot
Revenue isn’t always the most important metric for a business.
The problem: An IT consultancy uses gross margin as its primary KPI across the business, however HubSpot does not allow reporting of gross margin by default.
The dilemma: There is no perfect solution, just options with pros and cons:
- Option 1: Adding a property in deals to record gross margin and then custom-building the reporting. The advantage is that it doesn’t break anything, so all functionality that will need top-line revenue figures still work (e.g. invoicing). The downside is that creating the reports is time-consuming and always going to be limited.
- Option 2: Recording gross margin in HubSpot’s default “Amount” property (i.e. the primary £ value used in HubSpot). This then means that all default reporting uses gross margin, as the client wants. The risk of this approach is that functionality that does require revenue is likely to be compromised.
The solution: Having tried option 1 and felt that the reporting was not strong enough, the client opted for option 2. In their case, the downsides were limited by the fact that they have a HubSpot integration with NetSuite that handles revenue-dependent functions like invoicing, leaving HubSpot to focus on sales and marketing performance.
The “clever” bit: The “amounts” are all calculated from price and cost data held within HubSpot, it would still be possible to calculate revenue figures, giving a fair degree of future proofing.
Bringing customer service and marketing to Magento ecommerce
Do you offer ecommerce but still prioritise offline relationships?
Background: A traditional in-store retail service is the core of our client’s offering. We had integrated HubSpot with their point-of-sale system to modernise the in-store experience. They also ran a Magento-based ecommerce site.
The problem: High net worth customers expect a seamless experience. It’s not a good look to call a customer who’s visited the shop and already ordered online to ask if they’re still interested!
The solution: Integrating HubSpot and Magento. Step one was to surface orders in HubSpot so the sales representatives had a full picture of a customer’s on and offline order history. HubSpot now also powers live chat, cart abandonment and customer service for ecommerce customers, extending the experience far beyond what Magento can do alone.
HubSpot updates
Are these the problem solvers you’ve been waiting for?
Customer Agent can now work with any of your systems
AI bots are now handling increasing numbers of customer enquiries, often delivering faster and better answers than human agents. Customer Agent (aka Breeze Customer Agent) is HubSpot’s tool for this. It’s able to learn from all your historic tickets, knowledge base and any other resources you want to give it access to. With its latest update, it can now access your customer’s record to give tailored replies. It can even connect with any of your systems via API. So it can handle tasks like updating statuses, retrieving invoices, or resetting passwords.
Why do we care?
If you can resolve 50%+ of enquiries before human involvement, the time savings are obvious. Don’t be put off by the terrible chatbot experiences we have all experienced, but do invest time to get it right. Klarna offers an interesting case study: a year ago, they fired their entire customer service team, claiming AI was the only way forward. Now they are hiring again, this time with AI supporting, not replacing, staff.
Learn more about Customer Agent in this video:

Expanded automation issue troubleshooting tool
You can now view and manage more types of automation issues directly in the workflows tool, making it easier to identify and fix problems.

Why do we care?
With any tool that empowers your teams to deliver change, mistakes will happen. As HubSpot is centred on customer interaction, errors can have a big impact, so any tool that will help unearth and resolve issues quickly will always be welcome.
More information being pulled into Sales Workspace
HubSpot continues to enhance Sales Workspace. This month sees an improved dashboard and increased information with deals – prioritisation indicators, company news, AI suggested tasks, and risk scores all to help sales reps be more productive and better prepared for calls.

Why do we care?
As discussed in a previous edition, Sales Workspace (essentially a home page in HubSpot for sales reps) has been well received by sales teams. These updates make it an even more valuable daily tool.
Automatic enrichment of contact properties based on incoming email
For a while, HubSpot has been able to automatically create contacts from incoming email, detecting names, titles etc in signatures. This new Breeze enhancement goes further, detecting:
- Additional contacts mentioned in conversations
- Dates of return from holiday (from out-of-office replies)
- Employees leaving a company (from email confirming their departure)
Why do we care?
Productivity increases always make us happy. We wanted to highlight this one to encourage caution. We’re not sure yet how well it handles known data or how accurate it’s detection is, although accuracy is likely to improve over time. Please share your experiences as you try it.
Host HubSpot content on a WordPress subfolder
SEOs and developers have long waited for this! HubSpot content (like landing pages) can now be hosted on your main domain instead of a subdomain.
Why do we care?
WordPress is still widely used yet multiple domains can complicate site management and hurt user experience and SEO. This update removes a key objection to using HubSpot for blogs and other content.

Why do we care?
Multiple domains can complicate site management, hurt user experience and SEO. This update removes a key objection to using HubSpot for blogs and other content.
Troubleshooting corner
Niggles put to bed. (A gentle bit of self-promotion to highlight the sort of small but painful challenges that we often end up sorting for clients). Please feel free to share your own discoveries that might help others.
- Form submissions from site going to spam folders → Identified that the cause was the use of a shared email so connected the form directly to the inbox
- Bot-created live chat tickets swamping customer services → Implemented workflow using calculated property to close tickets after 10 minutes of inactivity unless out of hours.
Good question!
Our view on questions we’ve been asked or have asked recently.
Q. Can we use HubSpot to generate and send personalised certificates to people that complete our courses?
A. We’d do this using Portant, a HubSpot app that has been designed to create personalised documents using HubSpot properties. HubSpot workflows would make the request, Portant could generate the pdf certificate that could be stored on the associated record in HubSpot and then sent to the successful participant automatically!
Have you joined the Edinburgh HubSpot User Group?
The Edinburgh HUG is a community of HubSpot users who meet regularly to share best practices, learn about new features, and network. Join us to connect with other professionals and enhance your HubSpot skills.
Until next time,
The Attacats
About the P.S. from Attacat newsletter
P.S. = Problem Solved
This monthly newsletter aims to create the “I didn’t realise HubSpot could do that” moments for our clients and other invested HubSpot users. Each month, we’ll share feature updates, opinions, and inspiring real-world examples, large and small, to help you rethink what’s possible with HubSpot.
Best delivered straight to your inbox…Subscribe Today >
In this edition
- The art of the possible
- HubSpot updates
- Troubleshooting corner
- Dealing with dashboard limits
- Long ticket resolution times and poor customer satisfaction
- Good question!
The art of the possible
Challenges big and small that we have been working on recently that might spark an idea for you.
Integrating “closed” industry-specific software with HubSpot
Are you being held back by a bit of software that has been designed for your industry?
Background: Our client runs much of their day-to-day operations on a patient management system. It does a great job of managing different locations, surgeries, staff etc.
The problem: Where the system falls down is its inability to do effective marketing and sales. And the customer’s data was “stuck” in the system.
The solution: After building a custom integration with the patient management software, we were able to “free-up” the data so we could use it with HubSpot’s sales and marketing tools (lead scoring, deal pipelines etc) and therefore create an end-to-end patient management process. Good data governance was also paramount as sensitive (i.e medical) data was involved.
The “clever” bit: Also being able to connect their phone software, WhatsApps, emails etc so the team could work in a single system.
The impact: 20% increase in connected calls and 50% improvement in lead response times, all leading to increased appointments/consultations.
What other situations might this apply to? We’ve seen this industry software problem in most industries, from dentists, to jewellers to travel to legal. Wherever you find yourself up against a software inflexibility problem that involves customer data, chances are HubSpot’s flexibility can overcome the limitation in one way or another.
Solving a common HubSpot adoption problem: departments!
Could your adoption of HubSpot be slower due to separate departments not talking to each other?
Background: HubSpot was not getting the use or adoption that management expected.
The problem: We discovered that each department was implementing HubSpot in its own way. There was no agreement on a unified process.
The solution: We set up monthly “champions” sessions and invited multiple parties to attend (sales, customer service, marketing and operations). This created a space for discussions around HubSpot adoption and process change, which brought together teams that traditionally might not have worked closely with each other.
The impact: Improved resolution times for customers, regular identification of opportunities to use HubSpot to improve existing processes and offer more to customers.
Understanding where customers are “dropping-off”
It might seem like a “basic”, but if you struggle to understand where you are losing customers in your sales process, you aren’t alone.
The problem: Our client has plenty of good data in HubSpot, the challenge was knowing what information was going to help and how to display it in a meaningful way. (A bit of a “wood from the trees” type of problem!)
The solution: A dashboard showing the entire sales journey with cancellation rates for each stage.
The “clever” bit: In this particular case, we found that it was the ability to break it all down by sales co-ordinator, with a snapshot view of individual deal win rates, that led to the “Aha!” moments.

Cutting time spent on repetitive deal creation
Ever found yourself entering the same deal information time and again? Read on…
The situation: Annual renewals! A new HubSpot deal was needed each year for every client renewing.
The problem: The deals often had 100s of line items that needed to be re-entered which was both tedious and error-prone. Although apps were a possible solution they were rejected on security and flexibility grounds.
The solution: We created a deal duplicator tool within HubSpot. It copies all the details, including the associations and attachments and still allows us to control the edge cases.

The “clever bit”: It’s built entirely using HubSpot functionality (UI extensions on top of objects). That’s why it feels “native”.
What could you use it for: Repeat orders, complex subscriptions or reinstating cancelled deals. We use it in our portal for managing monthly retainers. (HubSpot have since released their own deal duplicator but its functionality is much more limited)
HubSpot updates
Are these the problem solvers you’ve been waiting for?
The Breeze vision: making HubSpot “AI-first”
(Breeze is a brand name for all the AI tools HubSpot is integrating into its product. Worth noting is that you probably have more access to Breeze than you realise. Breeze Intelligence is an additional paid feature but most subscriptons include Breeze actions).
![]()
This recent article from HubSpot’s head of AI is a must-read. If you feel you just can’t keep up with all the developments in AI, then you will probably find this article quite reassuring.
It sets out the vision of how HubSpot itself will evolve into an AI-powered tool to increase your internal productivity and improve your overall customer experience.
Please make sure you read it to the end and don’t allow yourself to be put off by some of the bits (like the diagram below) that are a little more techy. And on that note, “GTM” = Go To Market strategy)

Why do we care?
I hope the key takeaway from the article is simple: there’s no need to panic about AI. HubSpot has your back.
Businesses that can effectively harness their customer data and internal expertise with the help of AI will gain a serious competitive edge. And the good news? HubSpot is doing the hard work of keeping up with the rapid changes in AI for you. That means you’re already on the path to becoming one of those businesses.
And whilst we’re talking about Breeze…
“Ask Breeze” actions in workflows
You can now include Breeze actions in workflows! (included in Pro and Enterprise subscriptions)
Why do we care?
This opens up many new automation possibilities and also the opportunity to add to your data.
For example, we’ve been testing out it for populating the industry category property in HubSpot. We get the Ask Breeze action to “go away, research the company and categorise it” and then automatically populate the field.
Privacy Data Requests
This new feature (available on all tiers) will help you to manage the process of dealing with a subject access request including:
- providing a page for contacts to make a subject access request that you can link to from your privacy page
- A management screen for keeping track of requests

The good news is that you still get to review the export before you send it to the contact.
Why do we care?
Whilst we’ve long been able to delete or export a contact’s data from HubSpot, handling a subject access request has remained a complex task. This makes it easier and also enables you to demonstrate a commitment to GDPR compliance. (Did you know, a possible silver lining of Trump’s tariff turmoil could be a simplification of GDPR rules?)
Time and time again
Time-related updates just keep on coming. This month we’re getting:
- Time in a deal stage – displayed on the record (technically this is a “stage calculated property”)

- Workflow timings based on the customer’s time zone – so for example, all users can receive your weekly email at 9am on Monday morning wherever they are in the world.
- Anniversary filters – a neater solution for triggering workflows based on birthdays or any recurring date.
Why do we care?
It all just helps eliminate the need for more complex workflows or error-prone workarounds.
Property option colours
HubSpot now lets you add colour to property options. It’s a small update, but could help important records stand out and improve the overall user experience for your teams.
Who cares? I do!
If you’ve seen Monday.com, you’ll know they make a big deal of their colourful UI. But if you’ve used Monday.com, you’ll also know that pretty colours alone don’t equal good UX. Contrast that with Slack—where thoughtful use of colour enhances usability and makes it a place people actually enjoy using.
That’s why I like this new HubSpot feature. Even though the current colour palette is quite limited, it’s a step in the right direction. Just one tip: use it sparingly. Too much colour quickly becomes visual noise. The example below? A textbook case of going way too far!

Improved report search
If you only build HubSpot reports now and then, the improved search function makes it easier to get your bearings thanks to more helpful templates and suggestions.

Troubleshooting corner
Niggles put to bed. (A gentle bit of self-promotion to highlight the sort of small but painful challenges that we often end up sorting for clients). Please feel free to share your own discoveries that might help others.
- Hitting subscription dashboard limits → Reviewed all existing dashboards and reports, assessed must-have vs. nice-to-have data requirements and consolidated dashboards.
- Long ticket resolution times and poor customer satisfaction → Implemented task queue process and reporting to reduce customer confusion and support smoother handovers between agents.
Good question!
Our view on questions we’ve been asked or have asked recently.
Q. Can you use HubSpot with a mixed model of employees, self-employed and outsourced sales agents?
A. Yes. Every company with this sort of set-up will have differing requirements but the flexibility of HubSpot would, one way or other, allow you to build a solution. You’d probably end up taking advantage of some or all of:
- Granular access-level controls to give differing permissions to employees vs self-employed agents;
- The API to integrate with your outsourced provider so systems are kept in sync;
- Lead assignment options to funnel leads to available agents;
- App connections e.g. Slack or Google sheets to manage agents;
- Ability to access from anywhere – this may be an obvious one given that HubSpot is cloud-based but many companies with a complex set-up may still be stuck with legacy systems where the ability to login from anywhere on any device is far from a given.
Have you joined the Edinburgh HubSpot User Group?
If you find this newsletter useful, make sure you also join the Edinburgh HUG. Most events are remote so all HubSpot users are welcome to join, whether Edinburgh-based or not.
Until next time!
The Attacats
About the P.S. from Attacat newsletter
P.S. = Problem Solved
This monthly newsletter aims to create the “I didn’t realise HubSpot could do that” moments for our clients and other invested HubSpot users. Each month, we’ll share feature updates, opinions, and inspiring real-world examples, large and small, to help you rethink what’s possible with HubSpot.
Best delivered straight to your inbox…Subscribe Today >
In this edition
The art of the possible
Challenges big and small that we have been working on recently that might spark an idea for you.
The paper “flag” in a well-established events management process
Even in 2025, looking for customer-related processes that still use paper is a great way to find easy wins. Here’s one example.
Background: Camp America is a highly successful and well-run company that has accumulated many processes over its long history. Since 1969, they have been matching young people with American summer camp jobs. Events are a key part of their process, but until recently, applicants registered on paper!
The problem: The paper-based registration was the loose thread, that when tugged, revealed a whole process ripe for improvement. With hundreds attending each event, a lot of organisation and communication is needed. Everyone knew the inefficiencies, but fixing a fragmented process spanning multiple systems is never simple.
The solution: We migrated processes from other systems (including spreadsheets!) to enable automation and communication on applicants’ terms. At the events themselves, applicants can now be matched to camps on the spot.
The “clever” bit: Using HubSpot’s built-in functionality to build an events management system. HubSpot is so much more than a marketing CRM – knowing that it has also been designed for solving operational challenges opens up a myriad of opportunities.
The impact: As Katy Yucel, Camp America’s Marketing Director expresses best in the video testimonial below, it’s saving a lot of time and stress!

What other situations might this apply to? Other similar “flags” you could look for are:
- post (“snail mail”),
- printers or photocopiers
- spreadsheets handling customer processes or data.
Managing demand for a controlled luxury brand for a dealer
If you are an authorised dealer of an exclusive brand, this may sound familiar.
Background: Our luxury retail client has an exclusive dealership for a brand (let’s say it’s Ferrari – it’s not, but it helps imagine the scenario!).
The problem: They needed to maintain a waiting list and regularly share customer and model details with the brand— all managed by our familiar foe, a spreadsheet.
The solution: We built data capture into HubSpot, allowing seamless list management. This reduced data issues, enabled automated customer follow-ups, reused existing customer info, and provided required reports on schedule— improving the customer experience while reducing workload.
The “clever” bit: Spotting the opportunity and cutting the number of systems down by one.
What other situations might this apply to? Dealer-brand relationships in cars, fashion, prime property—or anywhere product scarcity (real or artificial) exists.
Logging what you don’t sell
Are customers asking for things you don’t offer? Log it!
The opportunity: Frequent requests for certain brands or features provide valuable insights for buying or product teams.
The solution: In this case, it was shop floor in-person interactions, so we created the ability to log the requests in HubSpot. If conversations are already recorded (chats, emails, calls), retrospective AI analysis works too. Either way, decisions should be based on data, not anecdotes.
Understanding customer cross-over between business units
Do your service teams work independently? Are they benefiting each other?
The problem: A client launched a new product, hoping it would drive sales of existing offerings. But siloed teams lacked the insight to confirm this, and HubSpot had no built-in way to track if one action led to another.
The solution: Among other metrics, we identified customers who started with the new product and later bought others within an agreed window, then compared their lifetime value to other customers.
The “clever” bit: A customer code workflow action calculated “time in between”. (Data sets were not available at the time and would likely provide a more elegant solution today).
HubSpot updates
Are these the problem solvers you’ve been waiting for?
Help Desk layout and feature set improvements
Help Desk is the nerve centre of HubSpot’s customer services platform (Service Hub). New features include enhanced layout options for better ticket management, more flexible SLAs, and AI-powered tools for faster responses, including suggested replies and topic identification.
Why do we care?
HubSpot’s feature set is increasingly on par with top customer service platforms, making it more attractive to large corporates. This reduces the trade-off between advanced features and a unified customer view.
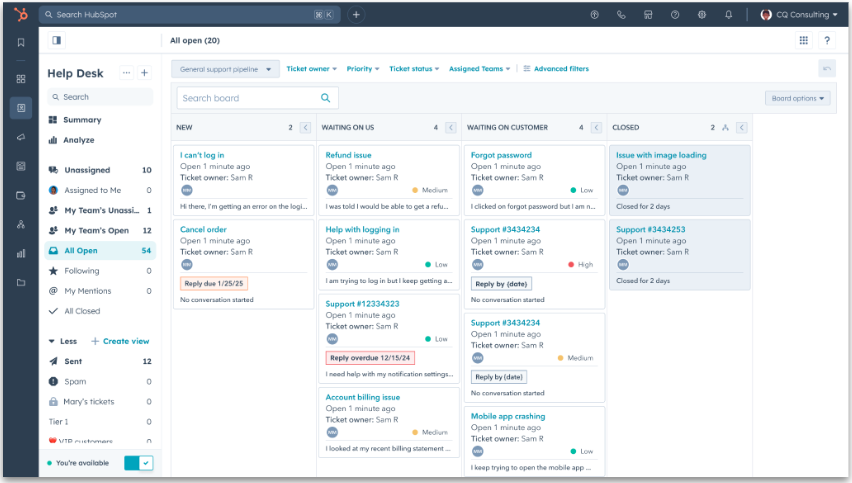
Side note: Help Desk is set to replace “Conversations Inbox.” If you missed our webinar on the transition you can watch it here:

Create ‘Time Since’ and ‘Time Until’ properties
The latest addition to the calculation and roll-up property stable lets you create time-based properties. For example, track “time until warranty expires” or “time since becoming a customer” and use it for reporting, filtering, or triggering automations. Lovely.
Why do we care?
A small but powerful update that unlocks possibilities and will bring joy to those of us who get frustrated by imperfections!
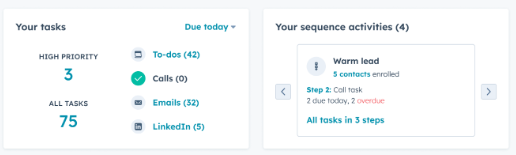
Sales Workspace is increasing its power
Sales Workspace serves as a home page for sales agent, reducing screen-hopping by centralising key info like deals and tasks. Now, priority tasks and sequences can be filtered, and users can customise their display.
Why do we care?
Workspace already brings out smiles whenever we demonstrate it to sales teams on HubSpot, so added power is a certain win. Hannah’s top tip: managers can use it to facilitate one-to-one meetings with their team.
New objects: appointments, courses, listings and services
HubSpot has expanded its standard objects beyond contacts, companies, deals, and tickets to cover appointments, courses, listings, and services.
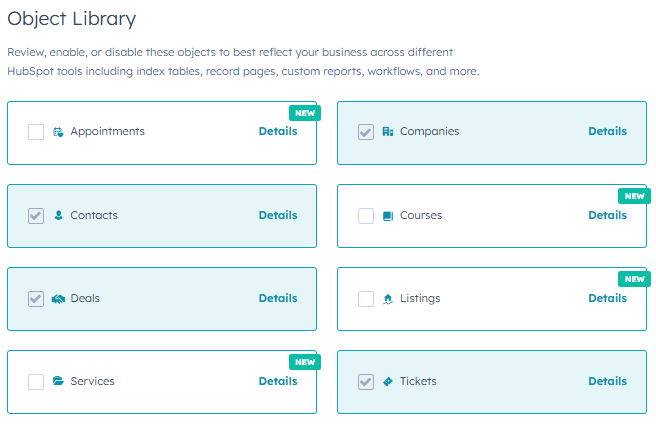
Why do we care?
Previously, creating these required an enterprise subscription. Now, more businesses on lower tiers can really customise.
Add calls, emails and meetings to campaigns
HubSpot’s “campaigns” were once purely marketing-focused, but sales teams often play a key role too. Now, calls, emails, and meetings can be assigned to campaigns for better tracking.
Why do we care?
Better attribution. And a (fair!) gripe from those familiar with Salesforce now put to bed.
Troubleshooting corner
Niggles put to bed. (A gentle bit of self-promotion to highlight the sort of small but painful challenges that we often end up sorting for clients). Please feel free to share your own discoveries that might help others.
- Newsletter delivery issues → Cleaned database, segmented engaged vs. non-engaged contacts to improve list quality.
- Incorrect deal info & duplicates → Traced to a DIY integration causing conflicts.
- Invoicing errors → Sales reps were changing deal properties post-sale—fixed with partial deal property locking.
Good question!
Our view on questions we’ve been asked or have asked recently.
Q. Would you be interested in a private forum for collaborating with other HubSpot users?
This was asked by a client recently. If there is enough interest, we would certainly be happy to facilitate it. So, if you’d be interested in being able to discuss all things HubSpot in an exclusive group with our other clients and selected HubSpot enthusiasts, please let us know!
Q. HubSpot are making a big sales push on Content Hub at the moment. Do I need it?
A. Content Hub has been re-envisioned from being a website content management system (a WordPress alternative) to also being a content marketing swiss army knife with a range of tools for generating content for all mediums from email to ads to podcasts. We really like the vision of it.
There are a couple of scenarios where you might give it serious consideration:
- Your marketing team is stretched – The Remix tool can generate new content (ads, emails, blog posts, etc.) from existing assets, helping you do more with less. As with all GenAI products, the human using the tool remains the difference between creating spam or a great customer experience.
- You are about to overhaul your website – HubSpot is investing heavily in its CMS, and having your site in the same system as your CRM can streamline operations and enhance personalisation.
Have you joined the Edinburgh HubSpot User Group?
If you find this newsletter useful, make sure you also join the Edinburgh HUG. Most events are remote so all HubSpot users are welcome to join, whether Edinburgh-based or not.
Until next time!
The Attacats
About the P.S. from Attacat newsletter
P.S. = Problem Solved
This monthly newsletter aims to create the “I didn’t realise HubSpot could do that” moments for our clients and other invested HubSpot users. Each month, we’ll share feature updates, opinions, and inspiring real-world examples, large and small, to help you rethink what’s possible with HubSpot.
Best delivered straight to your inbox…Subscribe Today >
In this edition
The art of the possible
Challenges big and small that we have been working on recently that might spark an idea for you.
“Matching” efficiency improved for a recruitment consultant
Do you routinely spend hours trying to pull together data for sales prospects? If so, this story may resonate.
Background: Business development managers (BDMs) at this recruitment consultancy make cold calls to hiring managers, offering lists of relevant candidates for active job postings to win contracts.
The problem: Preparing candidate lists for these calls was time-consuming and error-prone, relying on clunky macros and manual filtering in an overly complex spreadsheet that had “grown arms and legs”.
The solution: We imported the hiring managers’ currently advertised jobs into HubSpot in a structured format and created dynamic matches with relevant candidates. This allowed all the information to be displayed in HubSpot during the BDMs’ calls.
The “clever” bit: HubSpot’s “custom code workflow action” allowed us to create associations between the job and candidate objects based on defined matching criteria all held in HubSpot.
The impact: Countless hours were saved, enabling BDMs to focus on connecting with hiring managers rather than wrangling spreadsheets. With all the data now in HubSpot, new possibilities have opened up for lead scoring, automated email outreach, and follow-up.
What other situations might this apply to? This approach could work for any process involving “requirements” matching, such as:
- Matching collectors to auction items
- Pairing holidaymakers with holidays
- Connecting tenants to properties
- Matching car buyers to cars
And of course, any time you’re battling a bloated spreadsheet!
Improving response rates for a customer survey
Are your customer surveys being ignored, leaving you with little to no useful feedback? If so, this might strike a chord.
The problem: The CEO needed insights from her customer survey! So a comprehensive customer survey was created. However the response rate was very poor resulting in almost no insight.
The solution: We replaced the intense survey with a simple CSAT survey, complemented by automated workflows to follow up and collect the CEO’s additional data in a more targeted way.

The “clever” bit: Simply recognising that the survey was perceived as overwhelming and accepting that it’s better to get a higher response rate on more limited data first and then seek to gain additional insights where you can.
Keeping the deal pipeline up to date
Do deals in your pipeline often stall or get forgotten, leaving money on the table? You are not alone!
The problem: Deals in the pipeline were going stale because they were simply being missed by the sales team.
The solution: We introduced deal tags and automated notifications, making it easy for the sales team to see which deals needed attention. This was supported by a hands-on teach-in to ensure adoption.
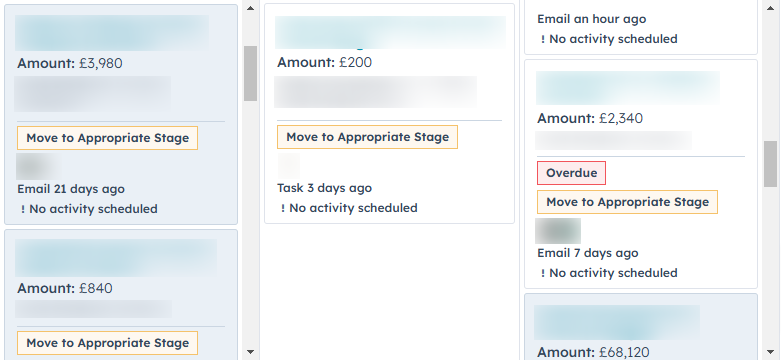
The “clever” bit: Taking a holistic approach (combining the customisation of the tools with practical training and making the pipeline more visible to the team).
Proving the impact of regular events
Are you struggling to show the ROI of your events, or finding it hard to keep up with post-event follow-ups? If so, this story could help.
The problem: Running regular marketing events was becoming a significant overhead with no visibility over their impact. Additionally, post-event follow-up might be (politely!) described as “inconsistent”.
The solution: We used HubSpot to streamline the event management process, set up consistent automated follow-ups and developed a customised dashboard to measure event success.
The “clever” bit: using workflows, injecting some consistent process and working out the right metrics.
What other situations might this apply to? Tracking the impact of webinars, training sessions, or product launches.
HubSpot updates
Are these the problem solvers you’ve been waiting for?
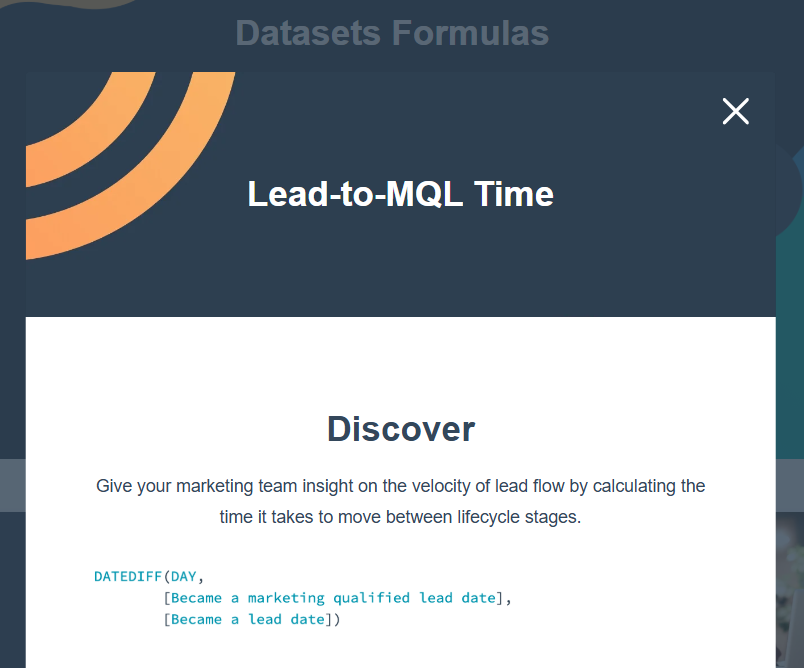
Datasets are now available in all hubs
(professional upwards)
One for the analysts! Datasets allow you to create new data fields by joining data in HubSpot using formulas (examples). In the past, this usually involved exporting data to a BI tool or other third-party tool, only to then display the output in a clunky square in your HubSpot dashboards. In extreme cases, we have used hidden pipelines and all sorts of workarounds to solve problems that datasets can now do. Tip: Use ChatGPT to help you create formulas.
Why do we care? The ability to answer many more questions for management without painful workarounds.
New and improved lead-scoring
The legacy lead scoring tool will be retired in August, but the good news is that it’s been replaced with a far more powerful and flexible alternative. If you’re still using the legacy tool, be aware that from May 1st, you’ll no longer be able to create new custom lead-scoring properties. So now is the perfect time to rethink how you score your leads and improve the accuracy of your insights.
Why do we care?
The new system offers:
- More flexible scoring criteria
- Built-in engagement decay for more realistic insights
- The ability to test as you build
- Fewer workarounds and workflows needed for complex scoring
If lead scoring matters to your business, this upgrade is worth exploring.
HubSpot now reports on Google’s PMAX campaigns
Google has been pushing advertisers to use PMAX campaigns for the last few years. As a result, they have become a mainstay for any company taking their Google Ads seriously. Finally, HubSpot can now report on them in the Ads report.
Why do we care? The lack of it was something we were moaning about in our Google Ads webinar in November! The problem was that it rendered the Ads report in HubSpot entirely useless.

Troubleshooting corner
Niggles put to bed. (A gentle bit of self-promotion to highlight the sort of small but painful challenges that we often end up sorting for clients). Please feel free to share your own discoveries that might help others.
- A pop-up not firing on a key page due to a redirect issue on an old site nobody had access to.
- A sudden unexplained drop in newsletter list size – in this case, it turned out to be related to a seasonal peak leading to increases in emails being automatically removed by the “unengaged” filter.
Good question!
Our view on questions we’ve been asked or have asked recently.
Q. Could you use the HubSpot AI assistant as a Grammerly alternative within HubSpot?
A. Not in its current form sadly. It only writes in US English and needs user proactivity rather than just working in the background as Grammarly does. It is useful for translation though! (Thanks to Lou at The Royal Mint for this really thoughtful question!)
Q. HubSpot are making a big sales push on Content Hub at the moment. Do I need it?
A. Yes, but only if you’ve done the prep work first! You’ll need to have developed a really good knowledge base and, for now, that needs to be one hosted on HubSpot. Expect it to get better over time and, in due course, we’d also expect it to be able to use content not hosted on HubSpot so it’s one to keep an eye on. It’s also a good reminder of the need to invest in your help content.
Until next time!
The Attacats
Google recently announced a new product Google Ads Data Manager. HubSpot was included as a launch partner. As you know, the bit of the Venn diagram where HubSpot and Google Ads overlap is an Attacat sweet spot, so of course we want to know all about it!
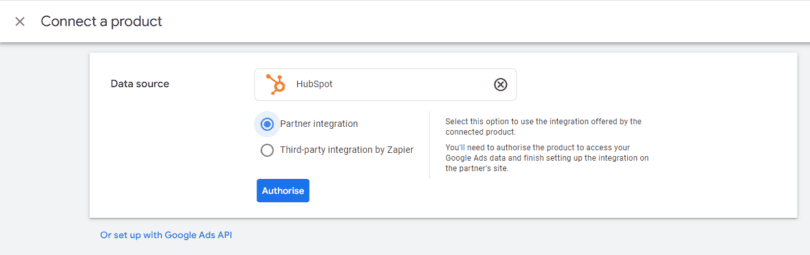
What is Data Manager?
It’s a newly released tool within Google Ads that allows an advertiser, without technical work, to connect Google Ads to third-party products (such as HubSpot and BigQuery) so they can talk to each other.
Why should HubSpot users care?
It allows:
- HubSpot customer lifecycle (i.e lead quality) information to be used in Google Ads for conversion tracking and bidding. Previously this ability to manage Google Ads lead generation campaigns towards lead quality and ultimately revenue took a lot of technical work. This “closing the loop” on tracking has perhaps always been the holy grail of B2B PPC advertising and now it’s a lot easier to do.
- It allows ad information to be reported on within HubSpot (nothing new there)
- It allows you to tell Google who your best customers are which Google’s algorithms can use to find similar people. Technically this is about giving Google audience data and doing it in a secure and automated way. No more manually having to send Google lists of email addresses.
It appears as a simple tick-box exercise if you want to connect a 3rd party product but like many “out-of-the-box” products, things aren’t always quite what they seem. There is still work to be done outside Data Manager if you want it to do the job you want:
- Tweaking of settings in Google Ads. In particular offline conversion import and Customer Match settings
- Tweaking of settings in HubSpot so HubSpot sends the right information to Google
- It does require Google tracking (either GA4 or Google Ads Conversion Tracking to already be in place, so if you don’t have that, there will be a need to get the tech team involved).
Side note: sadly there does not appear to be a similar product for GA4 with HubSpot. That’s something we are looking into.
Need help? Please get in touch.
A quick, fool-proof approach for mere mortals to get their data out of Universal Analytics (GA3) before Google deletes it forever.
This post outlines a free and pragmatic way to save your old universal analytics (UA) data into a spreadsheet before it gets deleted on the 1st July. It uses Attacat’s souped-up template rather than Google’s lousy one. Suitable for anyone who has used Google Analytics and can use basic spreadsheets. No technical knowledge required!
Overview of the process
- Open Attacat’s free Google Sheet
- Get the Google Sheets add-on
- Find your UA view number
- Hit run!
- Check and file away your data
Background
Fact: Your old data will be deleted on 1 July 2024
Google forced the world to move to its new version (GA4) of Google Analytics last July. Unlike previous version changes, historic data was not carried over as it is incompatible with the data being collected by GA4. For example, a GA3 page view does not equal a GA4 page view as they are measured differently.
So you probably have an old “Universal Analytics” (aka GA3) property in your Google Analytics account containing years of interesting data. If you don’t save this before 1st July, it will be lost forever.
A practical approach to saving your data
Google has outlined various approaches to exporting your data from the excruciatingly painful and largely useless (downloading individual reports) to using the techies-only API. Let me cut through these suggestions for you: the Google Sheets add-on (with a little Attacat freebie thrown in) will almost certainly be the right way forward.
The Google Sheets add-on allows you to rapidly suck a lot of data straight out of GA and into a regular spreadsheet without the need for any technical expertise. By following the instructions below, you can get everything you need with as little as 10 minutes work.
Using the add-on with the Attacat template instead
Google has provided their suggested template to use with the add-on which they claim will deliver the “most commonly used reports from the GA UI”. The contents of the template determines what data is exported by the add-on. I had a go with it and rapidly concluded that the template has not been created by someone who actually uses GA!
So I’ve had a happy day or so, creating my own version which I believe will instruct the ad-on to export all the key information that most businesses will ever be likely to have a need to call on. You can get it here.
How does the Attacat template compare to the Google template?
Steps in detail
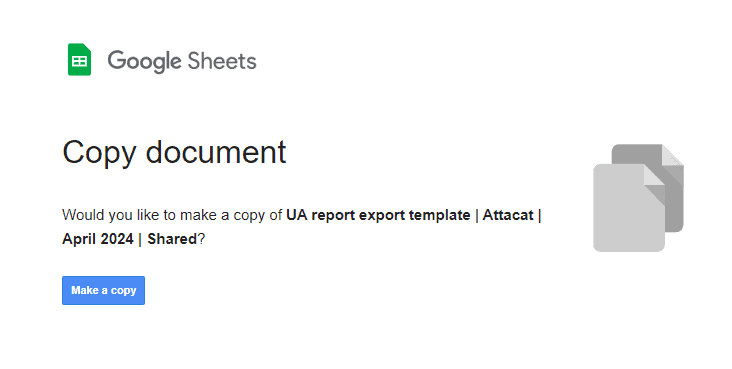
1. Make a copy of the Attacat Google Sheet Template
Simply help yourself to our template here. (Note: you must be logged into the google account that you use to access Google Analytics)
2. Install the Google Analytics add-on
In the extensions menu select Add-ons and Get add-ons:
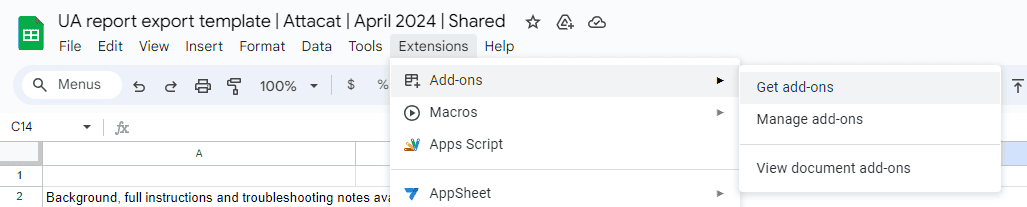
And then search for the Google Analytics add-on and select it to install it:
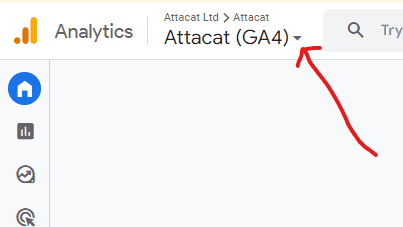
3a. Find your UA view number
Now go into your Google Analytics account and find your old Universal Analytics reports. There are various ways of getting there but my advice would be to:
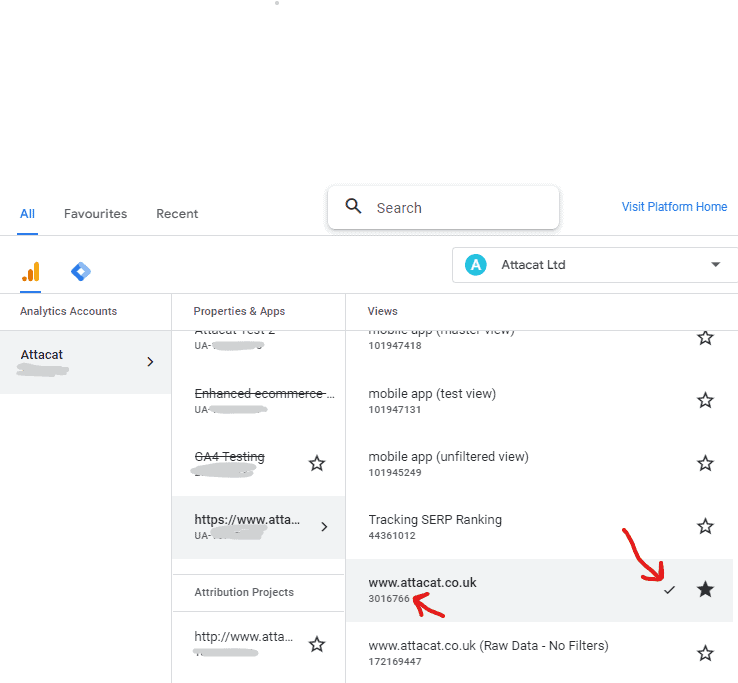
- Navigate to your old reports using the drop-down in the top left of your screen.
 You’ll need to find your way to the right “view” by first selecting your UA Property from the “Properties & Apps” column.
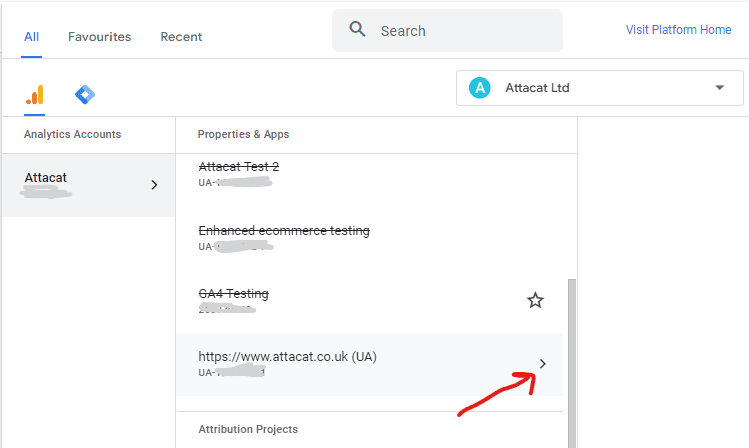 and then finding the right view:
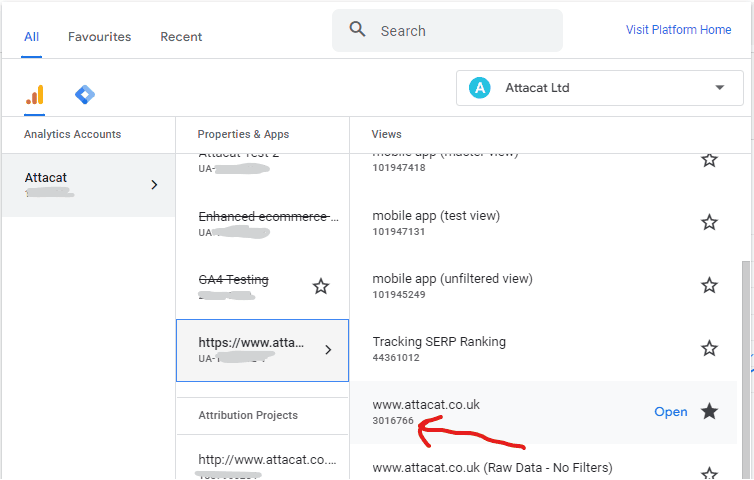
- Check you have the right “view” by looking at the reports and sense-checking the data. My suggestion would be to go to Audience > Overview.
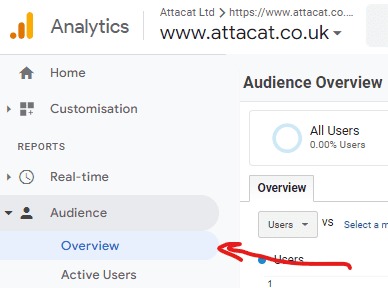
Whilst you are here change the date range so you go back to 1st Jan 2005 and work out how far back in time your data goes (note down the start date for later).The “All pages” report is also a good one to help you confirm that you have the right view. - Now find your view number by again clicking on the top left drop-down and the window you were in previously will re-open but this time with a tick against the view. It’s the number shown that you want.
3b. Enter your UA view number into your spreadsheet
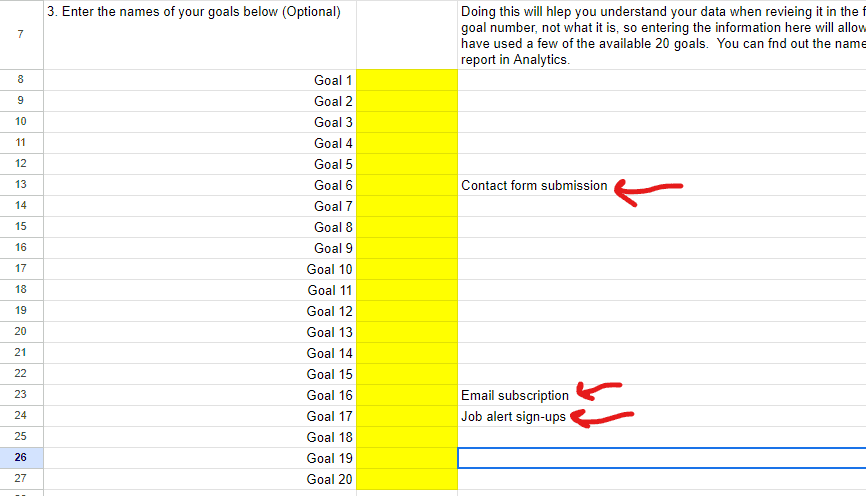
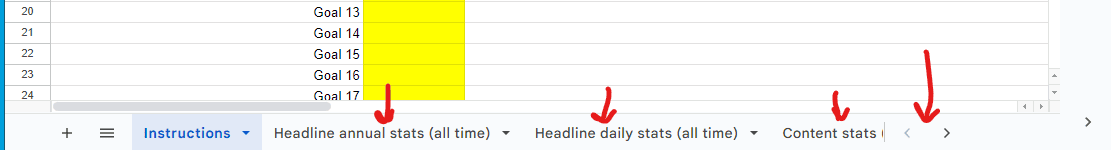
Now go back to the copy you have made of the Atacat template sheet and enter your view number into the yellow cell (It’s in the “instructions” tab of the spreadsheet)
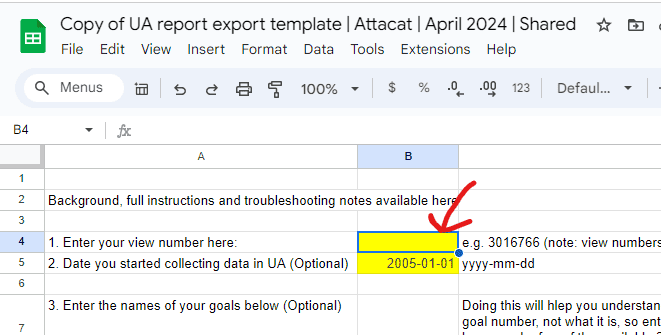
Optional but highly recommended additional steps:
- Enter the date you first set up analytics (in a UA report, set the from date to 1 Jan 2005 and then see when you first start collecting data).
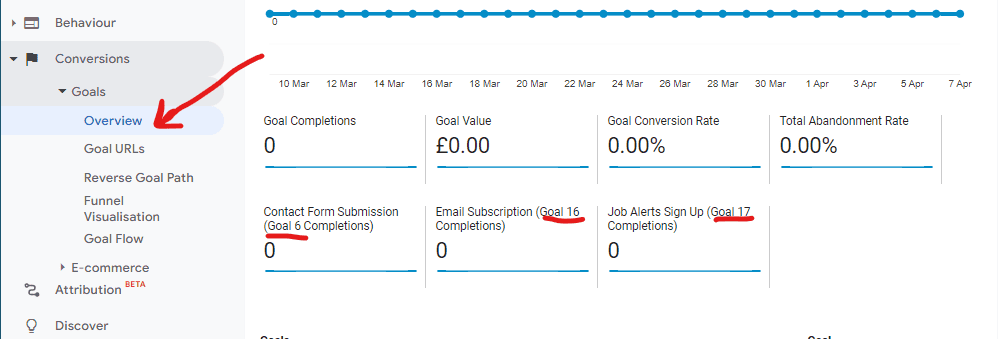
- Enter your goal information. You can find that in Analytics under Conversions > Goals. So for example:
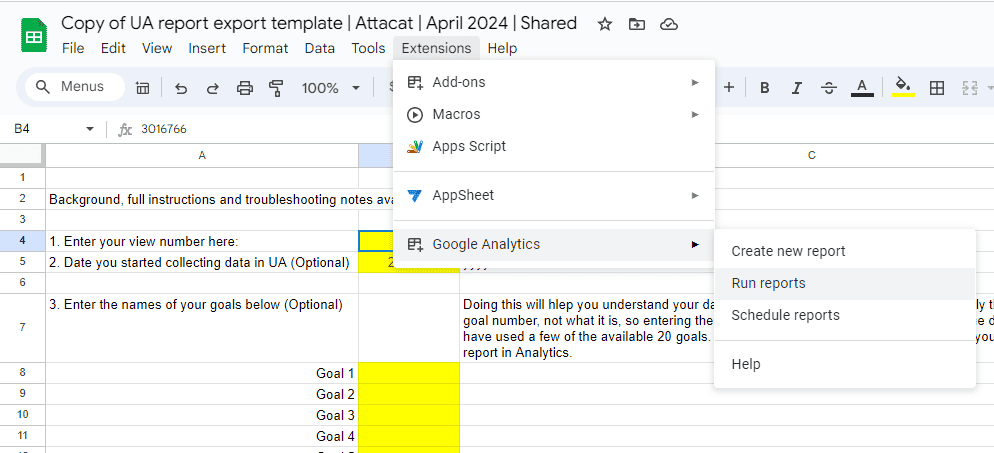
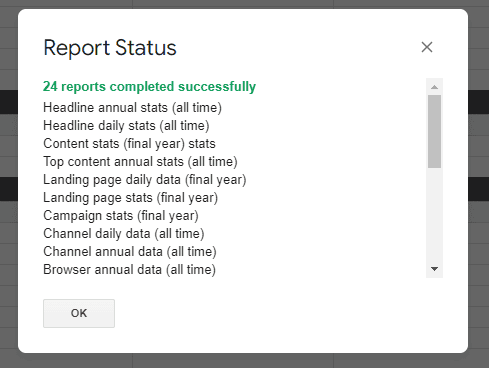
4. Run the export
This should be the simple bit! In the spreadsheet go back to the extensions menu, select “Google Analytics” and then “Run reports”. And after 30 seconds or so your data will have been exported to 24 gorgeous tabs of reports and data dumps. Just check that your status says “24 reports completed successfully” (if it says 23 or less investigate!! Something is up!)
Troubleshooting
For most people the export should just happen without a problem but occasionally you may run into an issue, especially if you have a very big or busy site. If you do hit issues, it’s likely due to one or more of the below factors:
- The “date glitch” – occasionally we’ve seen reports only run 2022 and 2023 data even when more historical data has been requested. In most cases we “solved” this by updating the date in the instructions sheet to the date when data first started to be recorded by Analytics. It feel like the system takes a huff if it has to chuff through many years of null data. It can cause the system to choose its own dates and decide to not include some data. So update the date to the date you started collecting data and re-run. (Update 18/04/24 – seeing increasingly that putting in a date of 23/08/2016 or later seems to solve the problem. Why? Who knows!)
- It requires the connections with Google Analytics to work perfectly. Whilst good it may be occasionally temperamental. Solution: re-run the report (Tip: Use row 13 (Skip) in the “Report Configuration” tab to only run the report(s) you want to re-run by putting the word “TRUE” in row 13 for all the reports you don’t want to run.)
- Successfully run reports with no data:
- If Analytics was never configured to collect the data we are trying to export, then there will be no data to export. For example if you don’t have site search set-up, there will be no data in the site search exports. This is also common with some of the more niche ecommerce reports (coupons etc)
- Landing page data – if you get zero data here its likely due to the filter being used to try to keep these exports manageable. Try deleting the filters for these exports (cells F9 and G9 in the report configuration tab) and re-run the report. (Ecommerce site? Try tweaking the filter from “ga:goalCompletionsAll” to “ga:transactionRevenue”)
- Limits exceeded
- Row limits (10,000?) – these can be exceeded in reports with data on pages or search terms. Where this happens the best place to start is to look for the troubleshooting notes (row 23) in the “report configuration” tab for the report in question.
- Spreadsheet size limit (10,000,000 cells) – this is unlikely to be an issue but find the report causing the issue by running a few reports at a time.
- Daily query limit – I haven’t hit this yet but if it happens to you, try coming back tomorrow to complete the job
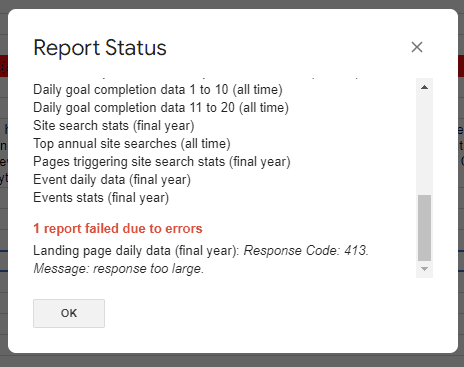
For further troubleshooting, you will probably need to follow the notes for advanced users below but the Report Status will often guide you as to what the problem is.
Example report status error reporting giving insight into what the issue likely is
Advanced users
The magic all happens in the “Reports Configuration” tab of the sheet. You can create any report you want by making changes in rows 2 to 17 or adding additional reports in further columns.
Some useful resources if you want to get your hands dirty:
- What each row in the configuration tab does (“the parameters”)
- The dimensions and metrics explorer – the place to go to when you have a particular column or row in mind that you want to include in a report.
Tip: Use row 13 (Skip) in the “Report Configuration” tab to only run the report you want by putting the word “TRUE” in row 13 for all the reports you don’t want to run.
5. Checking your data
Your data has now been exported into individual sheets within the spreadsheet. You can navigate between them using the tabs at the bottom of the sheet (you’ll need to scroll left and right using the < and > to see all your tabs/exports)
You need to check your data now as you won’t be able to after 1st July. So you need to have faith that the data is accurate and you have all the data you need. Here’s what I suggest:
- Run through all your exports (i.e. each tab of the spreadsheet) and get to know them. Do you understand the data, does the data look sensible?
- Check your headline daily stats (all time) report against the data in Universal Analytics “Audience Overview” report by comparing a couple of random days.
- (Optional) Now go to your GA3 (Universal Analytics) reports in the GA interface for one last time. Wade through every report in there and decide whether there is any report that you used a lot but isn’t covered by the exports. If there is, it’s time to become an advanced user (see above).
Question: Do I need to export all my data out of Google Analytics?
Answer: No. This is neither possible nor frankly worthwhile. Individual data types are not equally valuable to you and the older the data is, the less valuable it is. Our approach is to take a good range of “All time” data at both the daily and annual levels and then take some additional data from the last full 12 months of GA3 data collection (1 July 2022 to 30 June 2023)
6. Saving your data
Where you save your data will be a matter of personal choice. If you are not a regular Google sheets user you can export your data in excel format.
[image]
7. Please tell me how you got on!
I’m keen to make this as easy to use and as useful as I can, so would love to hear how you have got on with it, any issues and any improvement ideas. Please drop me a line here.
(This is step two in our Eight point checklist for GA4 that we shared in our recent Getting ready for GA4 webinar.)
A couple of weeks ago we shared an events list for e-commerce sites. But this is the article for you if your business website’s primary purpose is to encourage people to fill out a form on your site or to get in touch with you.
A reminder: what is an event?
An event is simply any interaction on your site that GA4 records for you.
If you know what is being recorded, then you’ll be able to:
- interpret your GA4 reports
- understand what your GA4 set-up can report on, even if there isn’t a report already set-up for it.
Importantly if you can’t see one or more of the events below in your GA4 event report, then Google Analytics will not be able to report on that interaction for you.
It’s also worth bearing in mind that you’ll only be able to report on an event from the date you start collecting it. So it’s good to think about what you might also want to report on in the future.
The generate_lead event
This is your single most important event. This is the interaction that the rest of your site builds towards: the completion of the form. You could call this interaction anything you want to.
But please don’t!
Instead, you should use this exact nomenclature. This is because Google will recognise its meaning. Over time they will provide more and more functions within GA4 and the Google ecosystem that makes use of this event. For example:
- standard reports that will be tailored to the specific need of lead gen sites;
- used in the algorithms that will guide your automated Google Ads campaigns.
Seeing your events
Simply go to your “Events report” in GA4 by going to Reports > Engagement > Events)).
Make sure you can see all the following events in your report:
You may also want some or all of the below events set up too:
Only able to see a small portion of the above events?
(Warning. Build up to the sales pitch!)
You are not alone! There is a common view that GA should just work. This is not helped by Google saying they will set your GA4 property up automatically for you.
GA has never been a “does everything straight out of the box product”. It does, and always has, required a lot of technical configuration to take full advantage of its capabilities. So if you can’t see those events, and want to be able to report on them, you will need to get them configured.
Whilst some web developers may be able to do it for you, our experience is that it’s not something they have the specialist knowledge to do well. That’s really not surprising given the number of bases a modern web dev needs to be able to cover.
GA configuration requires a very specific combination of marketing and technical skills. It also requires some pretty forensic levels of testing and issue resolution to make sure you are not only recording the data you need, but that you are also recording it accurately and in a privacy-compliant way.
So can Attacat help?
But of course! 😊